Immigrants from Austria vs Tongan 5th Grade
COMPARE
Immigrants from Austria
Tongan
5th Grade
5th Grade Comparison
Immigrants from Austria
Tongans
97.9%
5TH GRADE
99.6/ 100
METRIC RATING
66th/ 347
METRIC RANK
97.0%
5TH GRADE
5.3/ 100
METRIC RATING
226th/ 347
METRIC RANK
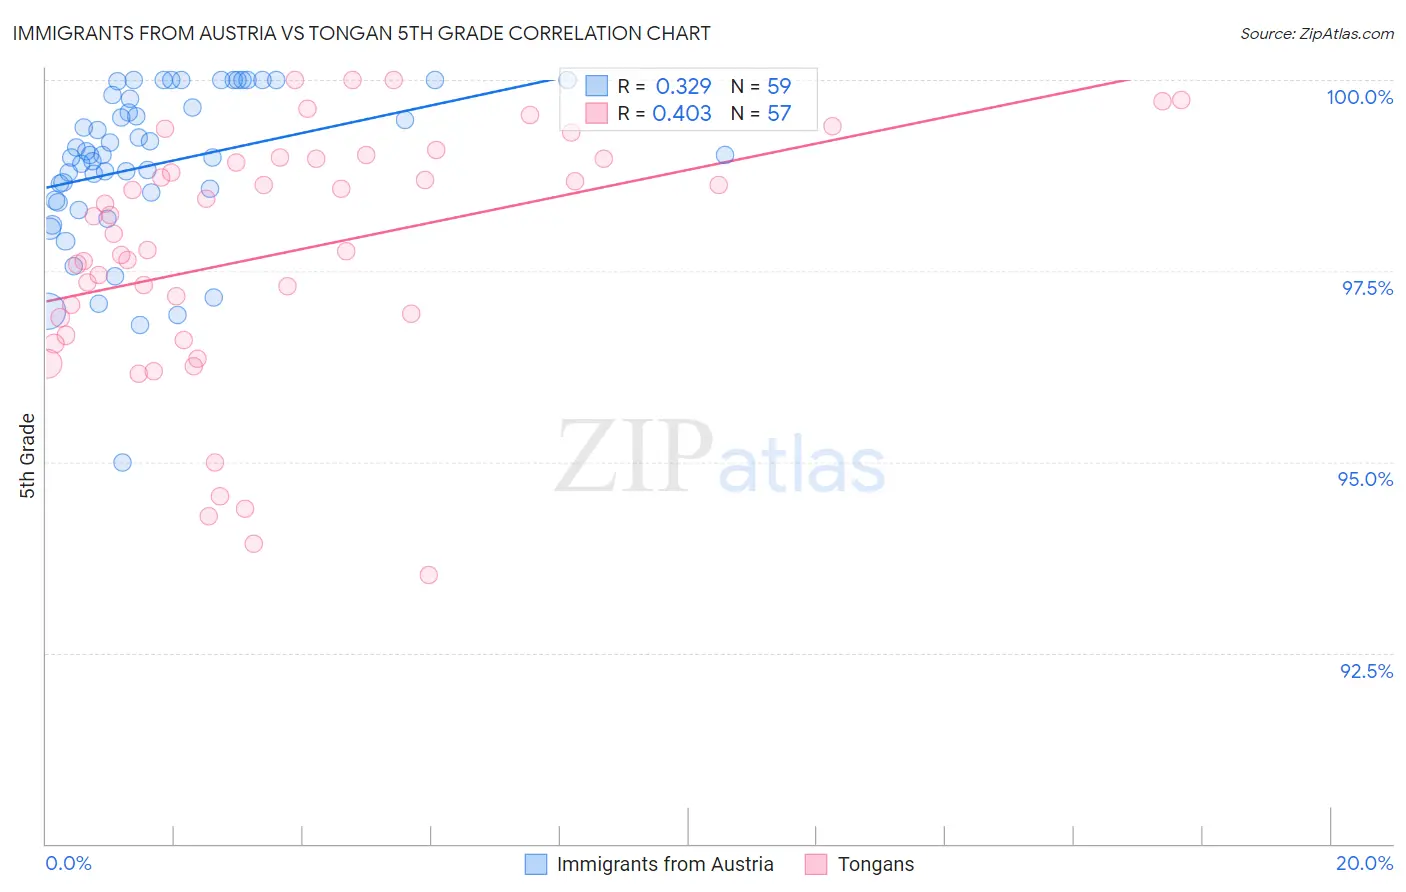
Immigrants from Austria vs Tongan 5th Grade Correlation Chart
The statistical analysis conducted on geographies consisting of 167,973,800 people shows a mild positive correlation between the proportion of Immigrants from Austria and percentage of population with at least 5th grade education in the United States with a correlation coefficient (R) of 0.329 and weighted average of 97.9%. Similarly, the statistical analysis conducted on geographies consisting of 102,877,776 people shows a moderate positive correlation between the proportion of Tongans and percentage of population with at least 5th grade education in the United States with a correlation coefficient (R) of 0.403 and weighted average of 97.0%, a difference of 0.88%.
5th Grade Correlation Summary
| Measurement | Immigrants from Austria | Tongan |
| Minimum | 95.0% | 93.5% |
| Maximum | 100.0% | 100.0% |
| Range | 5.0% | 6.5% |
| Mean | 98.9% | 97.7% |
| Median | 99.0% | 98.0% |
| Interquartile 25% (IQ1) | 98.4% | 96.8% |
| Interquartile 75% (IQ3) | 99.8% | 99.0% |
| Interquartile Range (IQR) | 1.4% | 2.2% |
| Standard Deviation (Sample) | 1.0% | 1.6% |
| Standard Deviation (Population) | 1.0% | 1.6% |
Similar Demographics by 5th Grade
Demographics Similar to Immigrants from Austria by 5th Grade
In terms of 5th grade, the demographic groups most similar to Immigrants from Austria are Canadian (97.9%, a difference of 0.0%), New Zealander (97.9%, a difference of 0.0%), Immigrants from Northern Europe (97.9%, a difference of 0.010%), Cajun (97.9%, a difference of 0.010%), and Russian (97.9%, a difference of 0.020%).
| Demographics | Rating | Rank | 5th Grade |
| Americans | 99.7 /100 | #59 | Exceptional 97.9% |
| Immigrants | Canada | 99.7 /100 | #60 | Exceptional 97.9% |
| Serbians | 99.7 /100 | #61 | Exceptional 97.9% |
| Immigrants | North America | 99.7 /100 | #62 | Exceptional 97.9% |
| Russians | 99.7 /100 | #63 | Exceptional 97.9% |
| Immigrants | Northern Europe | 99.6 /100 | #64 | Exceptional 97.9% |
| Canadians | 99.6 /100 | #65 | Exceptional 97.9% |
| Immigrants | Austria | 99.6 /100 | #66 | Exceptional 97.9% |
| New Zealanders | 99.6 /100 | #67 | Exceptional 97.9% |
| Cajuns | 99.6 /100 | #68 | Exceptional 97.9% |
| Kiowa | 99.5 /100 | #69 | Exceptional 97.9% |
| Iranians | 99.5 /100 | #70 | Exceptional 97.9% |
| Chickasaw | 99.5 /100 | #71 | Exceptional 97.9% |
| Macedonians | 99.4 /100 | #72 | Exceptional 97.9% |
| Cherokee | 99.4 /100 | #73 | Exceptional 97.8% |
Demographics Similar to Tongans by 5th Grade
In terms of 5th grade, the demographic groups most similar to Tongans are South American Indian (97.0%, a difference of 0.0%), Bahamian (97.0%, a difference of 0.0%), Sierra Leonean (97.1%, a difference of 0.010%), Immigrants from Panama (97.0%, a difference of 0.010%), and Liberian (97.0%, a difference of 0.010%).
| Demographics | Rating | Rank | 5th Grade |
| Immigrants | Syria | 6.4 /100 | #219 | Tragic 97.1% |
| Immigrants | Southern Europe | 6.3 /100 | #220 | Tragic 97.1% |
| Sierra Leoneans | 6.0 /100 | #221 | Tragic 97.1% |
| Immigrants | Panama | 5.7 /100 | #222 | Tragic 97.0% |
| Liberians | 5.7 /100 | #223 | Tragic 97.0% |
| South American Indians | 5.4 /100 | #224 | Tragic 97.0% |
| Bahamians | 5.3 /100 | #225 | Tragic 97.0% |
| Tongans | 5.3 /100 | #226 | Tragic 97.0% |
| Immigrants | Pakistan | 4.7 /100 | #227 | Tragic 97.0% |
| Assyrians/Chaldeans/Syriacs | 4.5 /100 | #228 | Tragic 97.0% |
| Yuman | 4.5 /100 | #229 | Tragic 97.0% |
| Immigrants | Western Asia | 4.3 /100 | #230 | Tragic 97.0% |
| Immigrants | Malaysia | 4.1 /100 | #231 | Tragic 97.0% |
| Immigrants | Eastern Asia | 4.0 /100 | #232 | Tragic 97.0% |
| Sub-Saharan Africans | 3.3 /100 | #233 | Tragic 97.0% |