Immigrants from Australia vs Lebanese 9th Grade
COMPARE
Immigrants from Australia
Lebanese
9th Grade
9th Grade Comparison
Immigrants from Australia
Lebanese
95.8%
9TH GRADE
99.5/ 100
METRIC RATING
70th/ 347
METRIC RANK
95.6%
9TH GRADE
98.1/ 100
METRIC RATING
100th/ 347
METRIC RANK
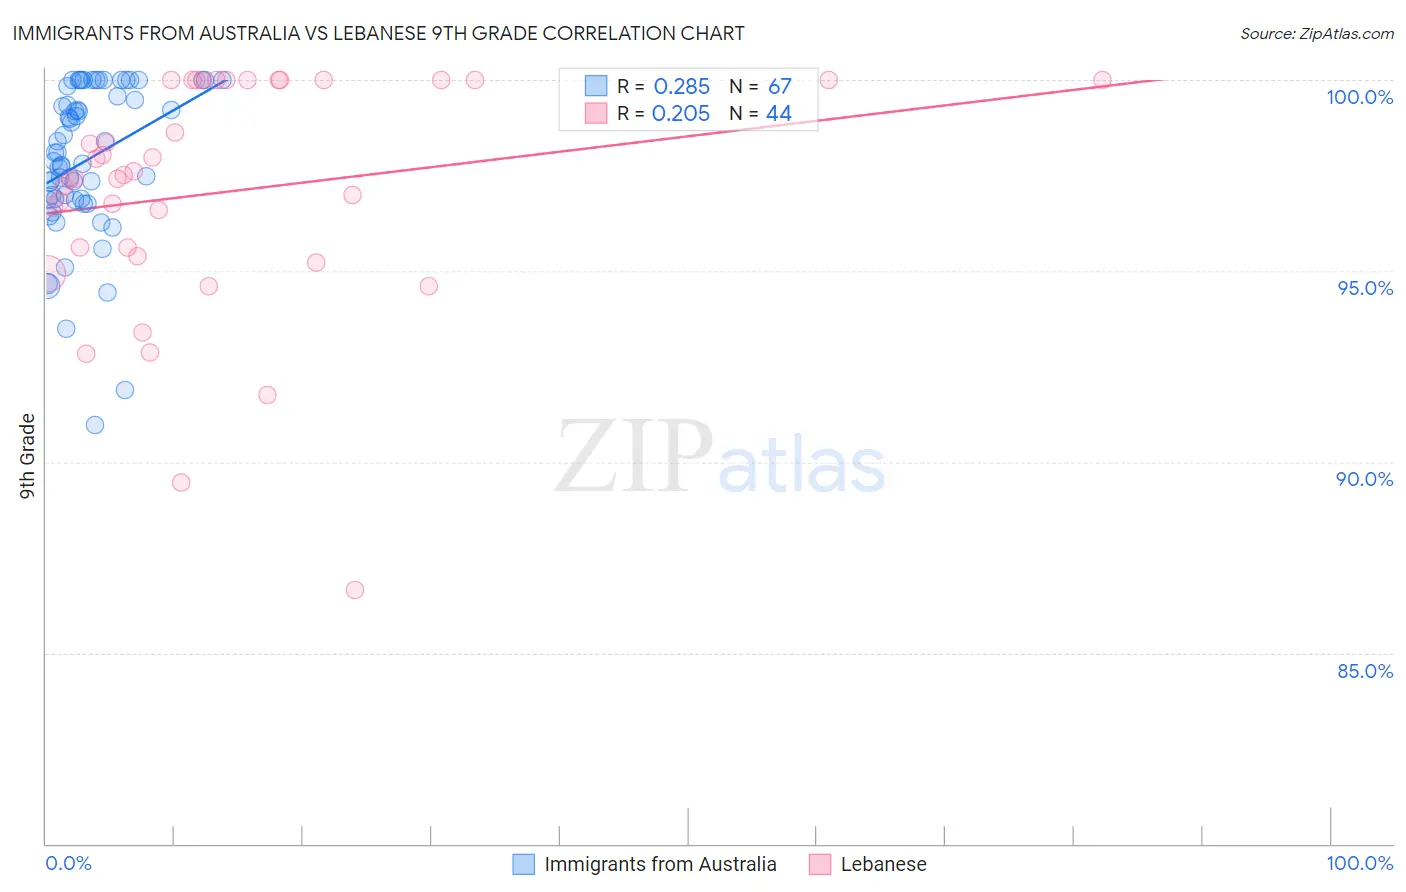
Immigrants from Australia vs Lebanese 9th Grade Correlation Chart
The statistical analysis conducted on geographies consisting of 227,202,602 people shows a weak positive correlation between the proportion of Immigrants from Australia and percentage of population with at least 9th grade education in the United States with a correlation coefficient (R) of 0.285 and weighted average of 95.8%. Similarly, the statistical analysis conducted on geographies consisting of 401,624,157 people shows a weak positive correlation between the proportion of Lebanese and percentage of population with at least 9th grade education in the United States with a correlation coefficient (R) of 0.205 and weighted average of 95.6%, a difference of 0.26%.
9th Grade Correlation Summary
| Measurement | Immigrants from Australia | Lebanese |
| Minimum | 91.0% | 86.6% |
| Maximum | 100.0% | 100.0% |
| Range | 9.0% | 13.4% |
| Mean | 97.9% | 97.1% |
| Median | 98.1% | 97.5% |
| Interquartile 25% (IQ1) | 96.9% | 95.5% |
| Interquartile 75% (IQ3) | 99.8% | 100.0% |
| Interquartile Range (IQR) | 3.0% | 4.5% |
| Standard Deviation (Sample) | 2.0% | 3.1% |
| Standard Deviation (Population) | 2.0% | 3.0% |
Similar Demographics by 9th Grade
Demographics Similar to Immigrants from Australia by 9th Grade
In terms of 9th grade, the demographic groups most similar to Immigrants from Australia are Immigrants from Belgium (95.8%, a difference of 0.010%), Turkish (95.8%, a difference of 0.010%), Immigrants from Singapore (95.8%, a difference of 0.010%), Thai (95.8%, a difference of 0.010%), and Cypriot (95.8%, a difference of 0.020%).
| Demographics | Rating | Rank | 9th Grade |
| Canadians | 99.7 /100 | #63 | Exceptional 95.9% |
| Zimbabweans | 99.7 /100 | #64 | Exceptional 95.9% |
| Immigrants | England | 99.6 /100 | #65 | Exceptional 95.9% |
| Immigrants | Netherlands | 99.6 /100 | #66 | Exceptional 95.8% |
| Cypriots | 99.6 /100 | #67 | Exceptional 95.8% |
| Immigrants | Ireland | 99.6 /100 | #68 | Exceptional 95.8% |
| Immigrants | Lithuania | 99.6 /100 | #69 | Exceptional 95.8% |
| Immigrants | Australia | 99.5 /100 | #70 | Exceptional 95.8% |
| Immigrants | Belgium | 99.5 /100 | #71 | Exceptional 95.8% |
| Turks | 99.5 /100 | #72 | Exceptional 95.8% |
| Immigrants | Singapore | 99.5 /100 | #73 | Exceptional 95.8% |
| Thais | 99.5 /100 | #74 | Exceptional 95.8% |
| Inupiat | 99.5 /100 | #75 | Exceptional 95.8% |
| Immigrants | Sweden | 99.5 /100 | #76 | Exceptional 95.8% |
| Whites/Caucasians | 99.4 /100 | #77 | Exceptional 95.8% |
Demographics Similar to Lebanese by 9th Grade
In terms of 9th grade, the demographic groups most similar to Lebanese are Immigrants from Japan (95.6%, a difference of 0.020%), Menominee (95.6%, a difference of 0.020%), Immigrants from Moldova (95.5%, a difference of 0.020%), Delaware (95.6%, a difference of 0.030%), and American (95.6%, a difference of 0.040%).
| Demographics | Rating | Rank | 9th Grade |
| Immigrants | Germany | 98.7 /100 | #93 | Exceptional 95.6% |
| Immigrants | Latvia | 98.7 /100 | #94 | Exceptional 95.6% |
| Americans | 98.5 /100 | #95 | Exceptional 95.6% |
| Filipinos | 98.5 /100 | #96 | Exceptional 95.6% |
| Delaware | 98.4 /100 | #97 | Exceptional 95.6% |
| Immigrants | Japan | 98.4 /100 | #98 | Exceptional 95.6% |
| Menominee | 98.3 /100 | #99 | Exceptional 95.6% |
| Lebanese | 98.1 /100 | #100 | Exceptional 95.6% |
| Immigrants | Moldova | 97.9 /100 | #101 | Exceptional 95.5% |
| Immigrants | Switzerland | 97.7 /100 | #102 | Exceptional 95.5% |
| Potawatomi | 97.7 /100 | #103 | Exceptional 95.5% |
| Syrians | 97.4 /100 | #104 | Exceptional 95.5% |
| Immigrants | France | 97.4 /100 | #105 | Exceptional 95.5% |
| Immigrants | Norway | 97.1 /100 | #106 | Exceptional 95.5% |
| Immigrants | Zimbabwe | 96.9 /100 | #107 | Exceptional 95.5% |