Immigrants from Argentina vs German 7th Grade
COMPARE
Immigrants from Argentina
German
7th Grade
7th Grade Comparison
Immigrants from Argentina
Germans
95.9%
7TH GRADE
21.9/ 100
METRIC RATING
201st/ 347
METRIC RANK
97.7%
7TH GRADE
100.0/ 100
METRIC RATING
9th/ 347
METRIC RANK
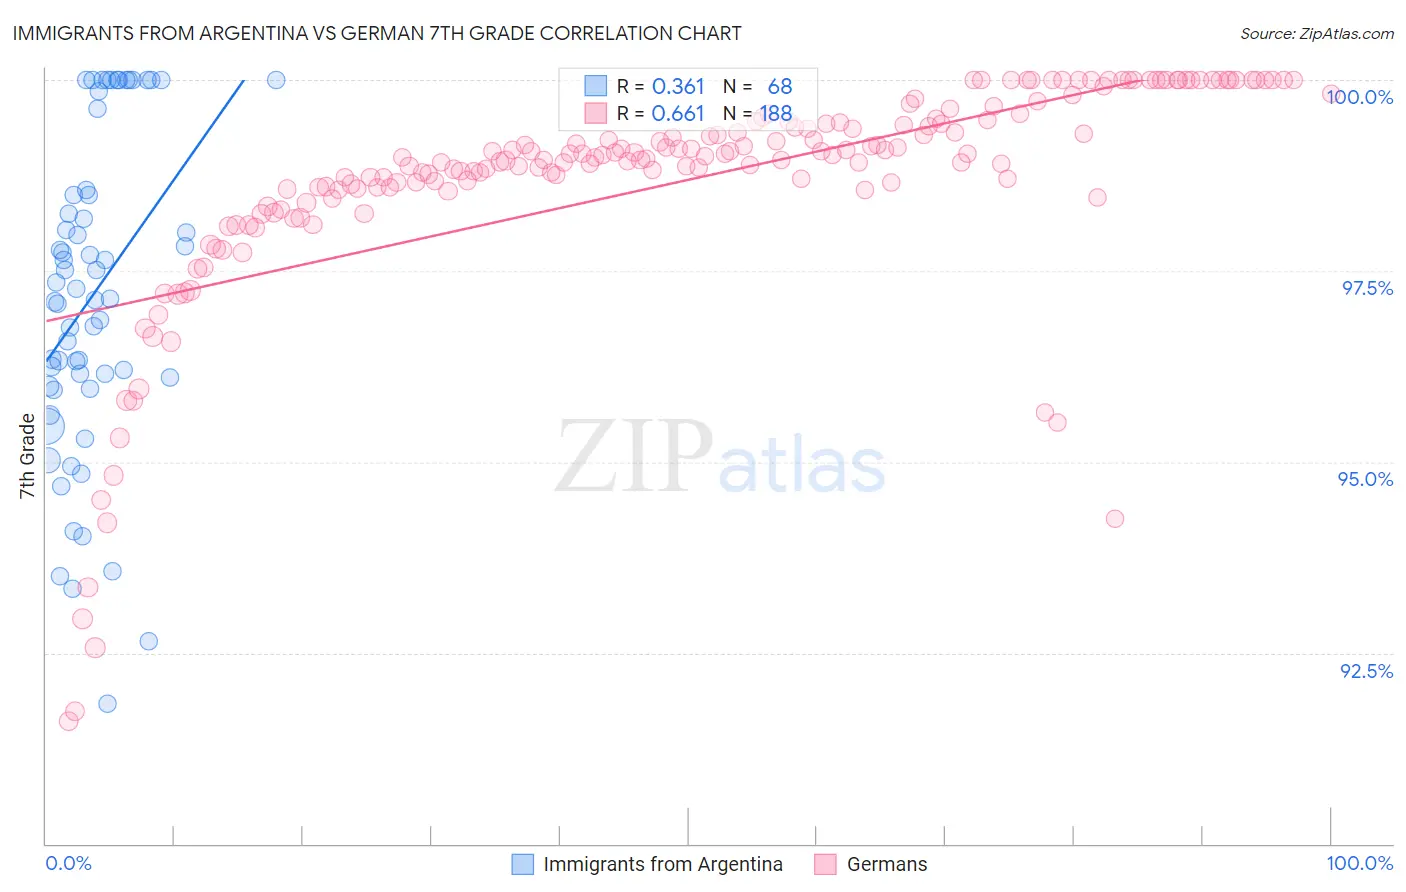
Immigrants from Argentina vs German 7th Grade Correlation Chart
The statistical analysis conducted on geographies consisting of 264,434,317 people shows a mild positive correlation between the proportion of Immigrants from Argentina and percentage of population with at least 7th grade education in the United States with a correlation coefficient (R) of 0.361 and weighted average of 95.9%. Similarly, the statistical analysis conducted on geographies consisting of 548,360,249 people shows a significant positive correlation between the proportion of Germans and percentage of population with at least 7th grade education in the United States with a correlation coefficient (R) of 0.661 and weighted average of 97.7%, a difference of 2.0%.
7th Grade Correlation Summary
| Measurement | Immigrants from Argentina | German |
| Minimum | 91.8% | 91.6% |
| Maximum | 100.0% | 100.0% |
| Range | 8.2% | 8.4% |
| Mean | 97.2% | 98.6% |
| Median | 97.2% | 99.0% |
| Interquartile 25% (IQ1) | 96.0% | 98.6% |
| Interquartile 75% (IQ3) | 98.5% | 99.5% |
| Interquartile Range (IQR) | 2.5% | 0.89% |
| Standard Deviation (Sample) | 2.1% | 1.5% |
| Standard Deviation (Population) | 2.1% | 1.5% |
Similar Demographics by 7th Grade
Demographics Similar to Immigrants from Argentina by 7th Grade
In terms of 7th grade, the demographic groups most similar to Immigrants from Argentina are Immigrants from Northern Africa (95.8%, a difference of 0.0%), Guamanian/Chamorro (95.9%, a difference of 0.010%), Argentinean (95.9%, a difference of 0.010%), Comanche (95.8%, a difference of 0.010%), and Assyrian/Chaldean/Syriac (95.8%, a difference of 0.010%).
| Demographics | Rating | Rank | 7th Grade |
| Immigrants | Nepal | 30.0 /100 | #194 | Fair 95.9% |
| Sudanese | 28.1 /100 | #195 | Fair 95.9% |
| Apache | 27.6 /100 | #196 | Fair 95.9% |
| Immigrants | Zaire | 26.7 /100 | #197 | Fair 95.9% |
| Paraguayans | 24.8 /100 | #198 | Fair 95.9% |
| Guamanians/Chamorros | 23.5 /100 | #199 | Fair 95.9% |
| Argentineans | 23.2 /100 | #200 | Fair 95.9% |
| Immigrants | Argentina | 21.9 /100 | #201 | Fair 95.9% |
| Immigrants | Northern Africa | 21.4 /100 | #202 | Fair 95.8% |
| Comanche | 21.1 /100 | #203 | Fair 95.8% |
| Assyrians/Chaldeans/Syriacs | 20.5 /100 | #204 | Fair 95.8% |
| Moroccans | 18.9 /100 | #205 | Poor 95.8% |
| Africans | 17.6 /100 | #206 | Poor 95.8% |
| Navajo | 17.0 /100 | #207 | Poor 95.8% |
| Immigrants | Sudan | 17.0 /100 | #208 | Poor 95.8% |
Demographics Similar to Germans by 7th Grade
In terms of 7th grade, the demographic groups most similar to Germans are Slovak (97.8%, a difference of 0.020%), Norwegian (97.8%, a difference of 0.030%), Tsimshian (97.8%, a difference of 0.060%), Slovene (97.6%, a difference of 0.10%), and Alaskan Athabascan (97.6%, a difference of 0.11%).
| Demographics | Rating | Rank | 7th Grade |
| Finns | 100.0 /100 | #2 | Exceptional 98.5% |
| Carpatho Rusyns | 100.0 /100 | #3 | Exceptional 98.3% |
| Ottawa | 100.0 /100 | #4 | Exceptional 98.1% |
| Dutch | 100.0 /100 | #5 | Exceptional 97.9% |
| Tsimshian | 100.0 /100 | #6 | Exceptional 97.8% |
| Norwegians | 100.0 /100 | #7 | Exceptional 97.8% |
| Slovaks | 100.0 /100 | #8 | Exceptional 97.8% |
| Germans | 100.0 /100 | #9 | Exceptional 97.7% |
| Slovenes | 100.0 /100 | #10 | Exceptional 97.6% |
| Alaskan Athabascans | 100.0 /100 | #11 | Exceptional 97.6% |
| Poles | 100.0 /100 | #12 | Exceptional 97.6% |
| Swedes | 100.0 /100 | #13 | Exceptional 97.6% |
| Pennsylvania Germans | 100.0 /100 | #14 | Exceptional 97.6% |
| English | 100.0 /100 | #15 | Exceptional 97.6% |
| Irish | 100.0 /100 | #16 | Exceptional 97.5% |