Immigrants from Argentina vs Immigrants from Northern Africa 9th Grade
COMPARE
Immigrants from Argentina
Immigrants from Northern Africa
9th Grade
9th Grade Comparison
Immigrants from Argentina
Immigrants from Northern Africa
94.8%
9TH GRADE
34.4/ 100
METRIC RATING
189th/ 347
METRIC RANK
94.7%
9TH GRADE
30.7/ 100
METRIC RATING
192nd/ 347
METRIC RANK
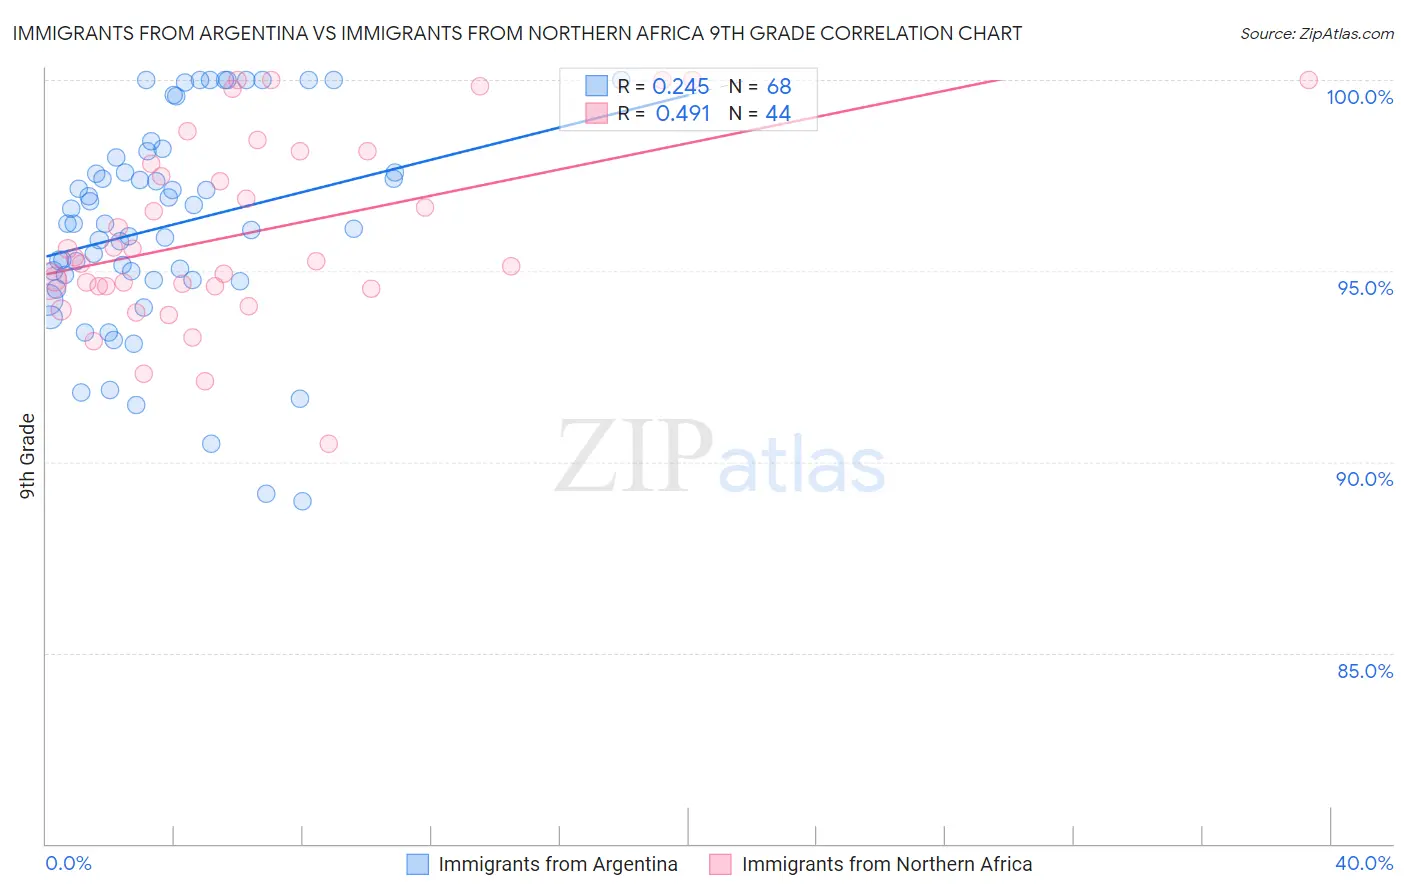
Immigrants from Argentina vs Immigrants from Northern Africa 9th Grade Correlation Chart
The statistical analysis conducted on geographies consisting of 264,436,618 people shows a weak positive correlation between the proportion of Immigrants from Argentina and percentage of population with at least 9th grade education in the United States with a correlation coefficient (R) of 0.245 and weighted average of 94.8%. Similarly, the statistical analysis conducted on geographies consisting of 321,196,768 people shows a moderate positive correlation between the proportion of Immigrants from Northern Africa and percentage of population with at least 9th grade education in the United States with a correlation coefficient (R) of 0.491 and weighted average of 94.7%, a difference of 0.030%.
9th Grade Correlation Summary
| Measurement | Immigrants from Argentina | Immigrants from Northern Africa |
| Minimum | 89.0% | 90.5% |
| Maximum | 100.0% | 100.0% |
| Range | 11.0% | 9.5% |
| Mean | 96.2% | 96.0% |
| Median | 96.2% | 95.3% |
| Interquartile 25% (IQ1) | 94.8% | 94.6% |
| Interquartile 75% (IQ3) | 97.8% | 98.0% |
| Interquartile Range (IQR) | 3.0% | 3.4% |
| Standard Deviation (Sample) | 2.7% | 2.4% |
| Standard Deviation (Population) | 2.7% | 2.4% |
Demographics Similar to Immigrants from Argentina and Immigrants from Northern Africa by 9th Grade
In terms of 9th grade, the demographic groups most similar to Immigrants from Argentina are Immigrants from Albania (94.8%, a difference of 0.0%), Guamanian/Chamorro (94.8%, a difference of 0.010%), Sudanese (94.7%, a difference of 0.010%), Liberian (94.8%, a difference of 0.020%), and Hopi (94.8%, a difference of 0.020%). Similarly, the demographic groups most similar to Immigrants from Northern Africa are Assyrian/Chaldean/Syriac (94.7%, a difference of 0.010%), Paraguayan (94.7%, a difference of 0.010%), Panamanian (94.7%, a difference of 0.010%), Sudanese (94.7%, a difference of 0.020%), and Marshallese (94.7%, a difference of 0.020%).
| Demographics | Rating | Rank | 9th Grade |
| Immigrants | Uganda | 43.1 /100 | #180 | Average 94.8% |
| Sierra Leoneans | 42.7 /100 | #181 | Average 94.8% |
| Seminole | 42.5 /100 | #182 | Average 94.8% |
| Immigrants | Nepal | 39.7 /100 | #183 | Fair 94.8% |
| Argentineans | 37.6 /100 | #184 | Fair 94.8% |
| Liberians | 37.4 /100 | #185 | Fair 94.8% |
| Hopi | 37.1 /100 | #186 | Fair 94.8% |
| Guamanians/Chamorros | 35.5 /100 | #187 | Fair 94.8% |
| Immigrants | Albania | 34.5 /100 | #188 | Fair 94.8% |
| Immigrants | Argentina | 34.4 /100 | #189 | Fair 94.8% |
| Sudanese | 32.7 /100 | #190 | Fair 94.7% |
| Assyrians/Chaldeans/Syriacs | 32.0 /100 | #191 | Fair 94.7% |
| Immigrants | Northern Africa | 30.7 /100 | #192 | Fair 94.7% |
| Paraguayans | 30.1 /100 | #193 | Fair 94.7% |
| Panamanians | 29.0 /100 | #194 | Fair 94.7% |
| Marshallese | 27.9 /100 | #195 | Fair 94.7% |
| Immigrants | Lebanon | 27.2 /100 | #196 | Fair 94.7% |
| Immigrants | Micronesia | 24.7 /100 | #197 | Fair 94.7% |
| Hawaiians | 22.7 /100 | #198 | Fair 94.7% |
| Laotians | 21.0 /100 | #199 | Fair 94.6% |
| Immigrants | Zaire | 20.6 /100 | #200 | Fair 94.6% |