Immigrants from Albania vs Immigrants from Latin America 6th Grade
COMPARE
Immigrants from Albania
Immigrants from Latin America
6th Grade
6th Grade Comparison
Immigrants from Albania
Immigrants from Latin America
96.9%
6TH GRADE
18.8/ 100
METRIC RATING
198th/ 347
METRIC RANK
94.7%
6TH GRADE
0.0/ 100
METRIC RATING
333rd/ 347
METRIC RANK
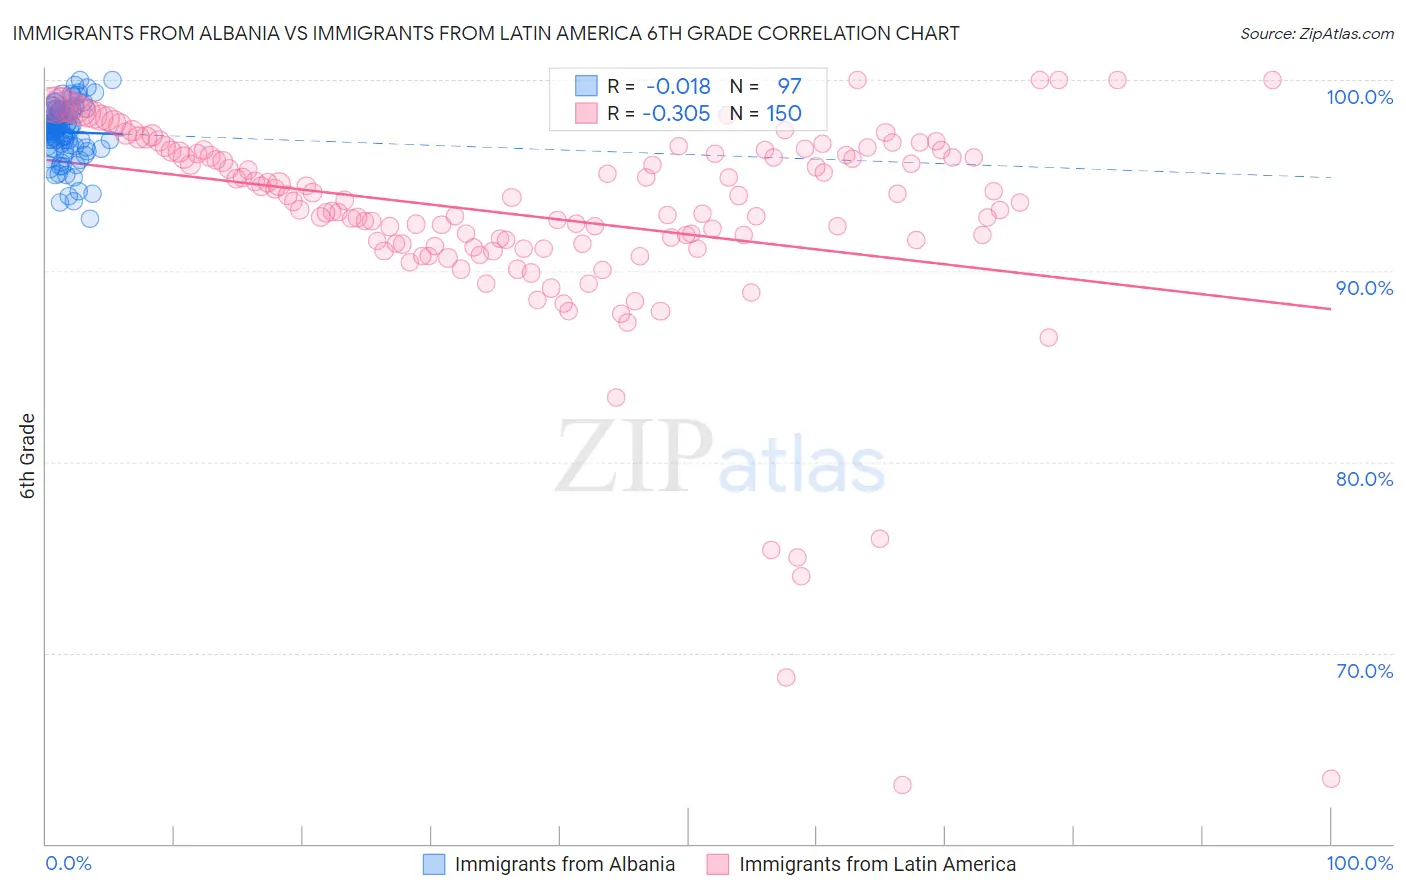
Immigrants from Albania vs Immigrants from Latin America 6th Grade Correlation Chart
The statistical analysis conducted on geographies consisting of 119,265,453 people shows no correlation between the proportion of Immigrants from Albania and percentage of population with at least 6th grade education in the United States with a correlation coefficient (R) of -0.018 and weighted average of 96.9%. Similarly, the statistical analysis conducted on geographies consisting of 558,652,608 people shows a mild negative correlation between the proportion of Immigrants from Latin America and percentage of population with at least 6th grade education in the United States with a correlation coefficient (R) of -0.305 and weighted average of 94.7%, a difference of 2.3%.
6th Grade Correlation Summary
| Measurement | Immigrants from Albania | Immigrants from Latin America |
| Minimum | 92.8% | 63.1% |
| Maximum | 100.0% | 100.0% |
| Range | 7.2% | 36.9% |
| Mean | 97.3% | 92.8% |
| Median | 97.4% | 93.7% |
| Interquartile 25% (IQ1) | 96.5% | 91.4% |
| Interquartile 75% (IQ3) | 98.3% | 96.3% |
| Interquartile Range (IQR) | 1.8% | 4.9% |
| Standard Deviation (Sample) | 1.5% | 5.9% |
| Standard Deviation (Population) | 1.5% | 5.9% |
Similar Demographics by 6th Grade
Demographics Similar to Immigrants from Albania by 6th Grade
In terms of 6th grade, the demographic groups most similar to Immigrants from Albania are Brazilian (96.9%, a difference of 0.010%), Immigrants from Uganda (96.9%, a difference of 0.020%), Immigrants from Northern Africa (96.9%, a difference of 0.020%), African (96.9%, a difference of 0.030%), and Immigrants from Brazil (96.9%, a difference of 0.040%).
| Demographics | Rating | Rank | 6th Grade |
| Panamanians | 27.3 /100 | #191 | Fair 96.9% |
| Hawaiians | 27.0 /100 | #192 | Fair 96.9% |
| Paraguayans | 26.6 /100 | #193 | Fair 96.9% |
| Immigrants | Lebanon | 25.6 /100 | #194 | Fair 96.9% |
| Immigrants | Brazil | 25.5 /100 | #195 | Fair 96.9% |
| Immigrants | Uganda | 21.2 /100 | #196 | Fair 96.9% |
| Brazilians | 20.1 /100 | #197 | Fair 96.9% |
| Immigrants | Albania | 18.8 /100 | #198 | Poor 96.9% |
| Immigrants | Northern Africa | 15.7 /100 | #199 | Poor 96.9% |
| Africans | 14.8 /100 | #200 | Poor 96.9% |
| Immigrants | Zaire | 14.5 /100 | #201 | Poor 96.9% |
| Immigrants | Chile | 14.2 /100 | #202 | Poor 96.8% |
| Sudanese | 13.9 /100 | #203 | Poor 96.8% |
| Immigrants | Bahamas | 13.8 /100 | #204 | Poor 96.8% |
| Natives/Alaskans | 13.0 /100 | #205 | Poor 96.8% |
Demographics Similar to Immigrants from Latin America by 6th Grade
In terms of 6th grade, the demographic groups most similar to Immigrants from Latin America are Immigrants from the Azores (94.7%, a difference of 0.020%), Mexican (94.6%, a difference of 0.040%), Immigrants from Dominican Republic (94.6%, a difference of 0.060%), Immigrants from Honduras (94.8%, a difference of 0.080%), and Immigrants from Armenia (94.9%, a difference of 0.19%).
| Demographics | Rating | Rank | 6th Grade |
| Hispanics or Latinos | 0.0 /100 | #326 | Tragic 95.0% |
| Mexican American Indians | 0.0 /100 | #327 | Tragic 95.0% |
| Hondurans | 0.0 /100 | #328 | Tragic 95.0% |
| Dominicans | 0.0 /100 | #329 | Tragic 94.9% |
| Nepalese | 0.0 /100 | #330 | Tragic 94.9% |
| Immigrants | Armenia | 0.0 /100 | #331 | Tragic 94.9% |
| Immigrants | Honduras | 0.0 /100 | #332 | Tragic 94.8% |
| Immigrants | Latin America | 0.0 /100 | #333 | Tragic 94.7% |
| Immigrants | Azores | 0.0 /100 | #334 | Tragic 94.7% |
| Mexicans | 0.0 /100 | #335 | Tragic 94.6% |
| Immigrants | Dominican Republic | 0.0 /100 | #336 | Tragic 94.6% |
| Central Americans | 0.0 /100 | #337 | Tragic 94.5% |
| Immigrants | Cabo Verde | 0.0 /100 | #338 | Tragic 94.4% |
| Yakama | 0.0 /100 | #339 | Tragic 94.3% |
| Guatemalans | 0.0 /100 | #340 | Tragic 94.2% |