English vs Immigrants from Latin America 6th Grade
COMPARE
English
Immigrants from Latin America
6th Grade
6th Grade Comparison
English
Immigrants from Latin America
98.1%
6TH GRADE
100.0/ 100
METRIC RATING
11th/ 347
METRIC RANK
94.7%
6TH GRADE
0.0/ 100
METRIC RATING
333rd/ 347
METRIC RANK
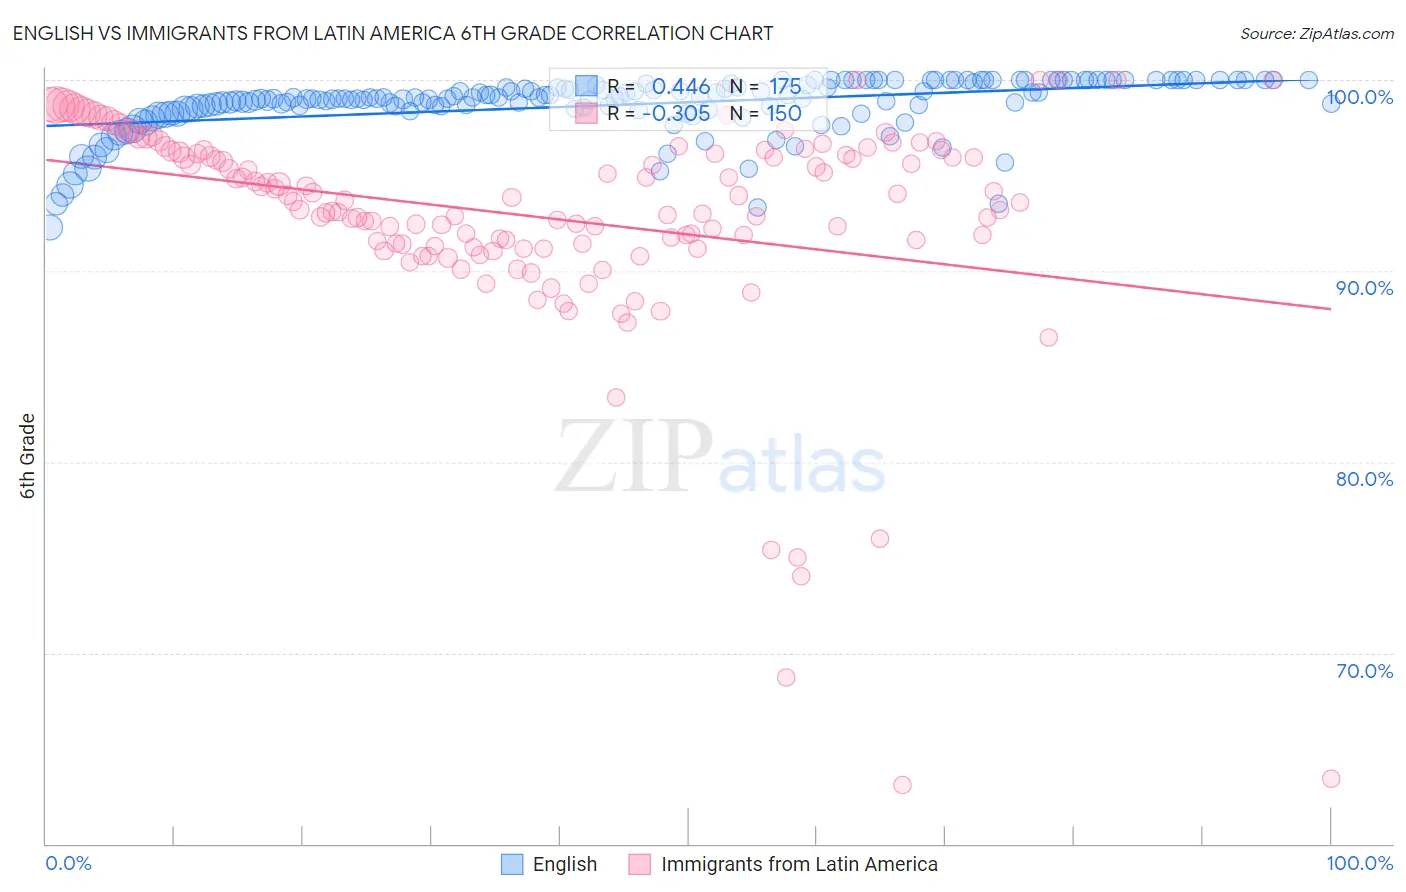
English vs Immigrants from Latin America 6th Grade Correlation Chart
The statistical analysis conducted on geographies consisting of 579,981,272 people shows a moderate positive correlation between the proportion of English and percentage of population with at least 6th grade education in the United States with a correlation coefficient (R) of 0.446 and weighted average of 98.1%. Similarly, the statistical analysis conducted on geographies consisting of 558,652,608 people shows a mild negative correlation between the proportion of Immigrants from Latin America and percentage of population with at least 6th grade education in the United States with a correlation coefficient (R) of -0.305 and weighted average of 94.7%, a difference of 3.7%.
6th Grade Correlation Summary
| Measurement | English | Immigrants from Latin America |
| Minimum | 92.3% | 63.1% |
| Maximum | 100.0% | 100.0% |
| Range | 7.7% | 36.9% |
| Mean | 98.7% | 92.8% |
| Median | 99.0% | 93.7% |
| Interquartile 25% (IQ1) | 98.5% | 91.4% |
| Interquartile 75% (IQ3) | 99.8% | 96.3% |
| Interquartile Range (IQR) | 1.3% | 4.9% |
| Standard Deviation (Sample) | 1.5% | 5.9% |
| Standard Deviation (Population) | 1.5% | 5.9% |
Similar Demographics by 6th Grade
Demographics Similar to English by 6th Grade
In terms of 6th grade, the demographic groups most similar to English are Swedish (98.2%, a difference of 0.010%), Alaskan Athabascan (98.1%, a difference of 0.010%), Tlingit-Haida (98.1%, a difference of 0.020%), Carpatho Rusyn (98.1%, a difference of 0.030%), and Slovene (98.2%, a difference of 0.040%).
| Demographics | Rating | Rank | 6th Grade |
| Dutch | 100.0 /100 | #4 | Exceptional 98.4% |
| Tsimshian | 100.0 /100 | #5 | Exceptional 98.3% |
| Norwegians | 100.0 /100 | #6 | Exceptional 98.3% |
| Germans | 100.0 /100 | #7 | Exceptional 98.2% |
| Slovaks | 100.0 /100 | #8 | Exceptional 98.2% |
| Slovenes | 100.0 /100 | #9 | Exceptional 98.2% |
| Swedes | 100.0 /100 | #10 | Exceptional 98.2% |
| English | 100.0 /100 | #11 | Exceptional 98.1% |
| Alaskan Athabascans | 100.0 /100 | #12 | Exceptional 98.1% |
| Tlingit-Haida | 100.0 /100 | #13 | Exceptional 98.1% |
| Carpatho Rusyns | 100.0 /100 | #14 | Exceptional 98.1% |
| Inupiat | 100.0 /100 | #15 | Exceptional 98.1% |
| Scottish | 100.0 /100 | #16 | Exceptional 98.1% |
| Poles | 100.0 /100 | #17 | Exceptional 98.1% |
| Pennsylvania Germans | 100.0 /100 | #18 | Exceptional 98.1% |
Demographics Similar to Immigrants from Latin America by 6th Grade
In terms of 6th grade, the demographic groups most similar to Immigrants from Latin America are Immigrants from the Azores (94.7%, a difference of 0.020%), Mexican (94.6%, a difference of 0.040%), Immigrants from Dominican Republic (94.6%, a difference of 0.060%), Immigrants from Honduras (94.8%, a difference of 0.080%), and Immigrants from Armenia (94.9%, a difference of 0.19%).
| Demographics | Rating | Rank | 6th Grade |
| Hispanics or Latinos | 0.0 /100 | #326 | Tragic 95.0% |
| Mexican American Indians | 0.0 /100 | #327 | Tragic 95.0% |
| Hondurans | 0.0 /100 | #328 | Tragic 95.0% |
| Dominicans | 0.0 /100 | #329 | Tragic 94.9% |
| Nepalese | 0.0 /100 | #330 | Tragic 94.9% |
| Immigrants | Armenia | 0.0 /100 | #331 | Tragic 94.9% |
| Immigrants | Honduras | 0.0 /100 | #332 | Tragic 94.8% |
| Immigrants | Latin America | 0.0 /100 | #333 | Tragic 94.7% |
| Immigrants | Azores | 0.0 /100 | #334 | Tragic 94.7% |
| Mexicans | 0.0 /100 | #335 | Tragic 94.6% |
| Immigrants | Dominican Republic | 0.0 /100 | #336 | Tragic 94.6% |
| Central Americans | 0.0 /100 | #337 | Tragic 94.5% |
| Immigrants | Cabo Verde | 0.0 /100 | #338 | Tragic 94.4% |
| Yakama | 0.0 /100 | #339 | Tragic 94.3% |
| Guatemalans | 0.0 /100 | #340 | Tragic 94.2% |