Immigrants from Africa vs Cuban 6th Grade
COMPARE
Immigrants from Africa
Cuban
6th Grade
6th Grade Comparison
Immigrants from Africa
Cubans
96.6%
6TH GRADE
1.3/ 100
METRIC RATING
246th/ 347
METRIC RANK
96.2%
6TH GRADE
0.1/ 100
METRIC RATING
283rd/ 347
METRIC RANK
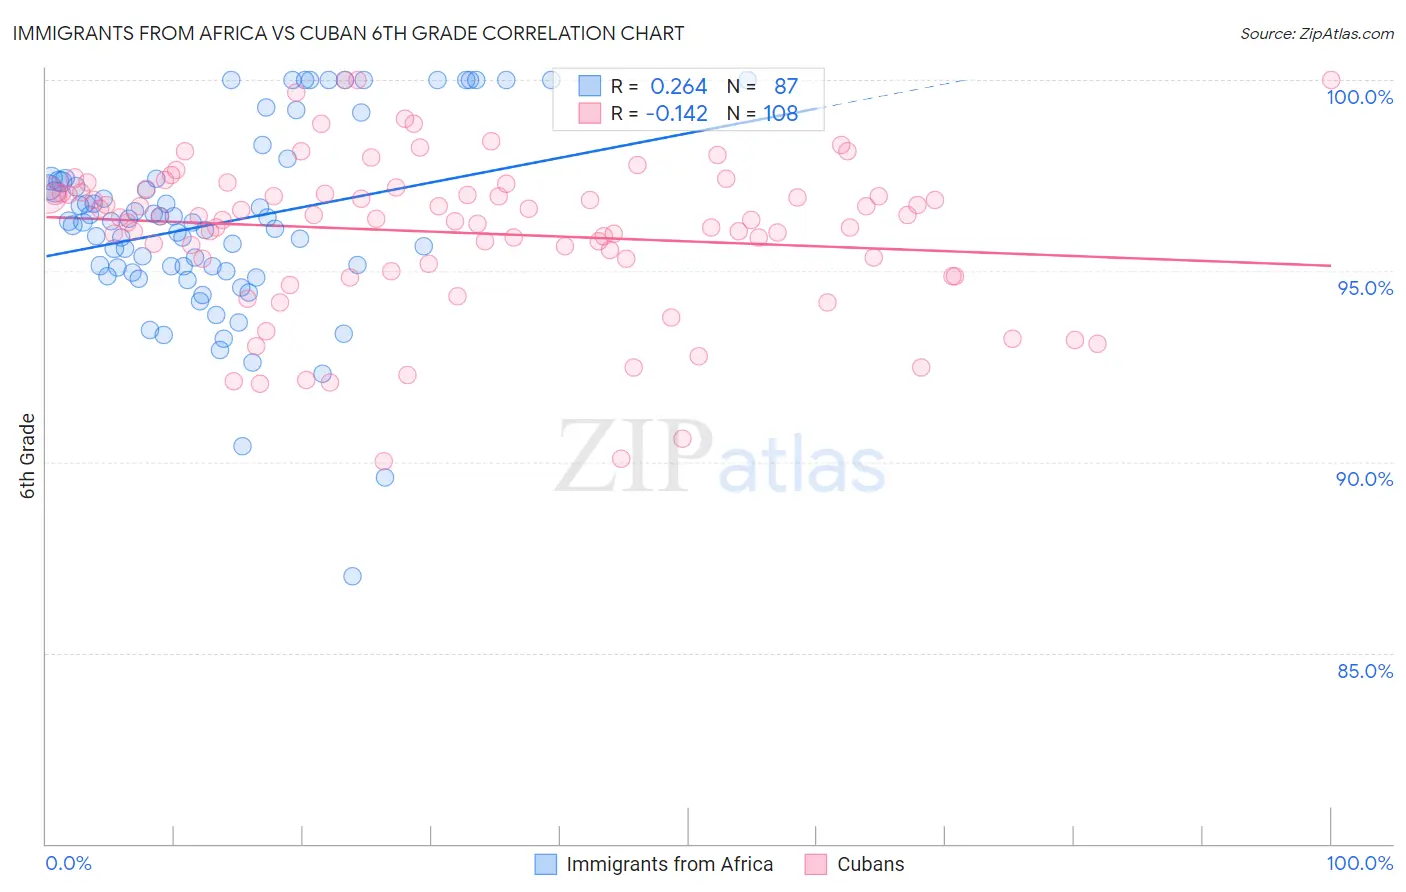
Immigrants from Africa vs Cuban 6th Grade Correlation Chart
The statistical analysis conducted on geographies consisting of 469,381,733 people shows a weak positive correlation between the proportion of Immigrants from Africa and percentage of population with at least 6th grade education in the United States with a correlation coefficient (R) of 0.264 and weighted average of 96.6%. Similarly, the statistical analysis conducted on geographies consisting of 449,326,865 people shows a poor negative correlation between the proportion of Cubans and percentage of population with at least 6th grade education in the United States with a correlation coefficient (R) of -0.142 and weighted average of 96.2%, a difference of 0.35%.
6th Grade Correlation Summary
| Measurement | Immigrants from Africa | Cuban |
| Minimum | 87.0% | 90.0% |
| Maximum | 100.0% | 100.0% |
| Range | 13.0% | 10.0% |
| Mean | 96.3% | 96.0% |
| Median | 96.3% | 96.4% |
| Interquartile 25% (IQ1) | 95.0% | 95.2% |
| Interquartile 75% (IQ3) | 97.4% | 97.0% |
| Interquartile Range (IQR) | 2.4% | 1.8% |
| Standard Deviation (Sample) | 2.5% | 2.0% |
| Standard Deviation (Population) | 2.5% | 2.0% |
Similar Demographics by 6th Grade
Demographics Similar to Immigrants from Africa by 6th Grade
In terms of 6th grade, the demographic groups most similar to Immigrants from Africa are Immigrants from Costa Rica (96.6%, a difference of 0.0%), Ethiopian (96.6%, a difference of 0.020%), Immigrants from Liberia (96.6%, a difference of 0.030%), Bolivian (96.5%, a difference of 0.030%), and Indian (Asian) (96.6%, a difference of 0.040%).
| Demographics | Rating | Rank | 6th Grade |
| Indians (Asian) | 1.9 /100 | #239 | Tragic 96.6% |
| Koreans | 1.9 /100 | #240 | Tragic 96.6% |
| Senegalese | 1.8 /100 | #241 | Tragic 96.6% |
| Immigrants | Asia | 1.8 /100 | #242 | Tragic 96.6% |
| Immigrants | Liberia | 1.6 /100 | #243 | Tragic 96.6% |
| Ethiopians | 1.5 /100 | #244 | Tragic 96.6% |
| Immigrants | Costa Rica | 1.3 /100 | #245 | Tragic 96.6% |
| Immigrants | Africa | 1.3 /100 | #246 | Tragic 96.6% |
| Bolivians | 1.0 /100 | #247 | Tragic 96.5% |
| Tohono O'odham | 1.0 /100 | #248 | Tragic 96.5% |
| Colombians | 0.9 /100 | #249 | Tragic 96.5% |
| Immigrants | Middle Africa | 0.8 /100 | #250 | Tragic 96.5% |
| Immigrants | Senegal | 0.7 /100 | #251 | Tragic 96.5% |
| Immigrants | Uruguay | 0.6 /100 | #252 | Tragic 96.5% |
| Jamaicans | 0.6 /100 | #253 | Tragic 96.5% |
Demographics Similar to Cubans by 6th Grade
In terms of 6th grade, the demographic groups most similar to Cubans are Trinidadian and Tobagonian (96.2%, a difference of 0.010%), Houma (96.2%, a difference of 0.010%), Fijian (96.2%, a difference of 0.010%), Immigrants from Peru (96.2%, a difference of 0.020%), and Immigrants from Afghanistan (96.2%, a difference of 0.020%).
| Demographics | Rating | Rank | 6th Grade |
| Yaqui | 0.1 /100 | #276 | Tragic 96.3% |
| Immigrants | Western Africa | 0.1 /100 | #277 | Tragic 96.3% |
| Immigrants | Thailand | 0.1 /100 | #278 | Tragic 96.3% |
| Immigrants | Peru | 0.1 /100 | #279 | Tragic 96.2% |
| Immigrants | Afghanistan | 0.1 /100 | #280 | Tragic 96.2% |
| Trinidadians and Tobagonians | 0.1 /100 | #281 | Tragic 96.2% |
| Houma | 0.1 /100 | #282 | Tragic 96.2% |
| Cubans | 0.1 /100 | #283 | Tragic 96.2% |
| Fijians | 0.1 /100 | #284 | Tragic 96.2% |
| Somalis | 0.1 /100 | #285 | Tragic 96.2% |
| Barbadians | 0.0 /100 | #286 | Tragic 96.2% |
| Immigrants | Trinidad and Tobago | 0.0 /100 | #287 | Tragic 96.2% |
| Malaysians | 0.0 /100 | #288 | Tragic 96.2% |
| Immigrants | Eritrea | 0.0 /100 | #289 | Tragic 96.1% |
| Immigrants | Somalia | 0.0 /100 | #290 | Tragic 96.1% |