Immigrants from Africa vs Immigrants from Caribbean 12th Grade, No Diploma
COMPARE
Immigrants from Africa
Immigrants from Caribbean
12th Grade, No Diploma
12th Grade, No Diploma Comparison
Immigrants from Africa
Immigrants from Caribbean
90.5%
12TH GRADE, NO DIPLOMA
8.5/ 100
METRIC RATING
214th/ 347
METRIC RANK
87.4%
12TH GRADE, NO DIPLOMA
0.0/ 100
METRIC RATING
313th/ 347
METRIC RANK
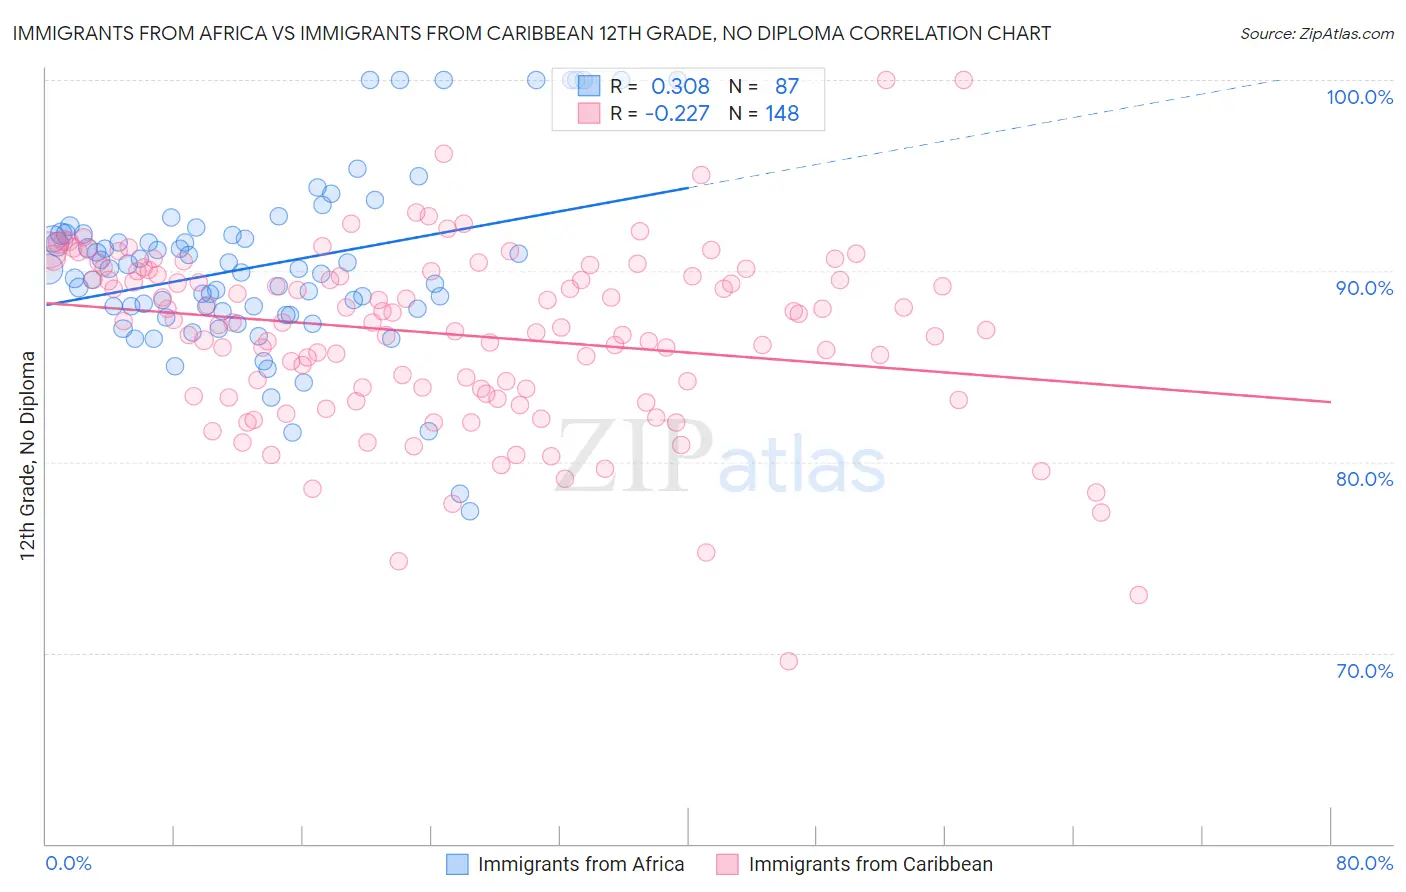
Immigrants from Africa vs Immigrants from Caribbean 12th Grade, No Diploma Correlation Chart
The statistical analysis conducted on geographies consisting of 469,408,443 people shows a mild positive correlation between the proportion of Immigrants from Africa and percentage of population with at least 12th grade (no diploma) education in the United States with a correlation coefficient (R) of 0.308 and weighted average of 90.5%. Similarly, the statistical analysis conducted on geographies consisting of 450,064,731 people shows a weak negative correlation between the proportion of Immigrants from Caribbean and percentage of population with at least 12th grade (no diploma) education in the United States with a correlation coefficient (R) of -0.227 and weighted average of 87.4%, a difference of 3.6%.
12th Grade, No Diploma Correlation Summary
| Measurement | Immigrants from Africa | Immigrants from Caribbean |
| Minimum | 77.4% | 69.6% |
| Maximum | 100.0% | 100.0% |
| Range | 22.6% | 30.4% |
| Mean | 90.3% | 86.7% |
| Median | 90.1% | 87.3% |
| Interquartile 25% (IQ1) | 87.9% | 83.7% |
| Interquartile 75% (IQ3) | 91.9% | 90.0% |
| Interquartile Range (IQR) | 4.1% | 6.3% |
| Standard Deviation (Sample) | 4.6% | 4.7% |
| Standard Deviation (Population) | 4.6% | 4.7% |
Similar Demographics by 12th Grade, No Diploma
Demographics Similar to Immigrants from Africa by 12th Grade, No Diploma
In terms of 12th grade, no diploma, the demographic groups most similar to Immigrants from Africa are Costa Rican (90.5%, a difference of 0.030%), Arapaho (90.5%, a difference of 0.030%), Shoshone (90.5%, a difference of 0.040%), Cherokee (90.5%, a difference of 0.040%), and Immigrants from Cameroon (90.5%, a difference of 0.040%).
| Demographics | Rating | Rank | 12th Grade, No Diploma |
| Armenians | 11.6 /100 | #207 | Poor 90.6% |
| Immigrants | Micronesia | 11.0 /100 | #208 | Poor 90.6% |
| Immigrants | Afghanistan | 11.0 /100 | #209 | Poor 90.6% |
| South American Indians | 10.9 /100 | #210 | Poor 90.6% |
| Portuguese | 10.6 /100 | #211 | Poor 90.6% |
| Somalis | 10.2 /100 | #212 | Poor 90.6% |
| Costa Ricans | 9.4 /100 | #213 | Tragic 90.5% |
| Immigrants | Africa | 8.5 /100 | #214 | Tragic 90.5% |
| Arapaho | 7.7 /100 | #215 | Tragic 90.5% |
| Shoshone | 7.5 /100 | #216 | Tragic 90.5% |
| Cherokee | 7.4 /100 | #217 | Tragic 90.5% |
| Immigrants | Cameroon | 7.4 /100 | #218 | Tragic 90.5% |
| Uruguayans | 7.0 /100 | #219 | Tragic 90.4% |
| Colombians | 6.6 /100 | #220 | Tragic 90.4% |
| Immigrants | Liberia | 5.7 /100 | #221 | Tragic 90.4% |
Demographics Similar to Immigrants from Caribbean by 12th Grade, No Diploma
In terms of 12th grade, no diploma, the demographic groups most similar to Immigrants from Caribbean are Cape Verdean (87.4%, a difference of 0.020%), Nicaraguan (87.3%, a difference of 0.050%), Apache (87.3%, a difference of 0.070%), Yaqui (87.5%, a difference of 0.12%), and Immigrants from Ecuador (87.5%, a difference of 0.12%).
| Demographics | Rating | Rank | 12th Grade, No Diploma |
| Natives/Alaskans | 0.0 /100 | #306 | Tragic 87.7% |
| Immigrants | Portugal | 0.0 /100 | #307 | Tragic 87.6% |
| Yup'ik | 0.0 /100 | #308 | Tragic 87.6% |
| Immigrants | Armenia | 0.0 /100 | #309 | Tragic 87.6% |
| Immigrants | Cuba | 0.0 /100 | #310 | Tragic 87.5% |
| Yaqui | 0.0 /100 | #311 | Tragic 87.5% |
| Immigrants | Ecuador | 0.0 /100 | #312 | Tragic 87.5% |
| Immigrants | Caribbean | 0.0 /100 | #313 | Tragic 87.4% |
| Cape Verdeans | 0.0 /100 | #314 | Tragic 87.4% |
| Nicaraguans | 0.0 /100 | #315 | Tragic 87.3% |
| Apache | 0.0 /100 | #316 | Tragic 87.3% |
| Navajo | 0.0 /100 | #317 | Tragic 87.1% |
| Belizeans | 0.0 /100 | #318 | Tragic 87.0% |
| Immigrants | Belize | 0.0 /100 | #319 | Tragic 87.0% |
| Immigrants | Nicaragua | 0.0 /100 | #320 | Tragic 86.6% |