Houma vs Israeli 12th Grade, No Diploma
COMPARE
Houma
Israeli
12th Grade, No Diploma
12th Grade, No Diploma Comparison
Houma
Israelis
83.7%
12TH GRADE, NO DIPLOMA
0.0/ 100
METRIC RATING
342nd/ 347
METRIC RANK
92.1%
12TH GRADE, NO DIPLOMA
96.8/ 100
METRIC RATING
112th/ 347
METRIC RANK
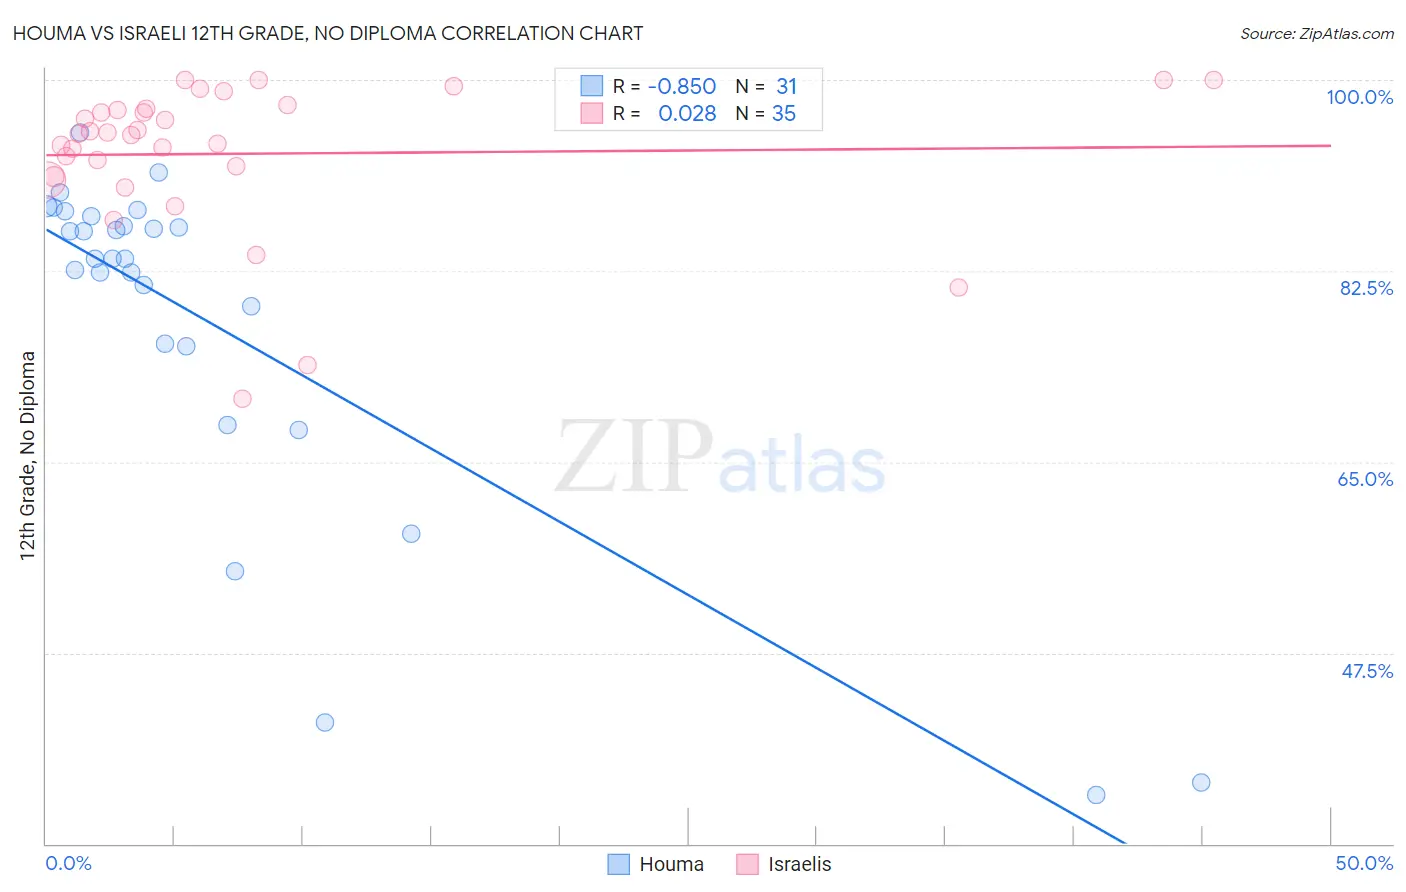
Houma vs Israeli 12th Grade, No Diploma Correlation Chart
The statistical analysis conducted on geographies consisting of 36,795,916 people shows a very strong negative correlation between the proportion of Houma and percentage of population with at least 12th grade (no diploma) education in the United States with a correlation coefficient (R) of -0.850 and weighted average of 83.7%. Similarly, the statistical analysis conducted on geographies consisting of 211,220,151 people shows no correlation between the proportion of Israelis and percentage of population with at least 12th grade (no diploma) education in the United States with a correlation coefficient (R) of 0.028 and weighted average of 92.1%, a difference of 10.0%.
12th Grade, No Diploma Correlation Summary
| Measurement | Houma | Israeli |
| Minimum | 34.4% | 70.8% |
| Maximum | 95.2% | 100.0% |
| Range | 60.8% | 29.2% |
| Mean | 77.6% | 93.2% |
| Median | 83.7% | 95.1% |
| Interquartile 25% (IQ1) | 75.6% | 91.2% |
| Interquartile 75% (IQ3) | 87.5% | 97.4% |
| Interquartile Range (IQR) | 11.9% | 6.2% |
| Standard Deviation (Sample) | 16.2% | 6.9% |
| Standard Deviation (Population) | 15.9% | 6.8% |
Similar Demographics by 12th Grade, No Diploma
Demographics Similar to Houma by 12th Grade, No Diploma
In terms of 12th grade, no diploma, the demographic groups most similar to Houma are Immigrants from El Salvador (83.6%, a difference of 0.16%), Immigrants from Guatemala (84.0%, a difference of 0.34%), Mexican (84.1%, a difference of 0.48%), Salvadoran (84.5%, a difference of 0.90%), and Immigrants from Central America (83.0%, a difference of 0.90%).
| Demographics | Rating | Rank | 12th Grade, No Diploma |
| Immigrants | Latin America | 0.0 /100 | #333 | Tragic 85.0% |
| Immigrants | Dominican Republic | 0.0 /100 | #334 | Tragic 84.9% |
| Immigrants | Yemen | 0.0 /100 | #335 | Tragic 84.8% |
| Tohono O'odham | 0.0 /100 | #336 | Tragic 84.7% |
| Pima | 0.0 /100 | #337 | Tragic 84.6% |
| Guatemalans | 0.0 /100 | #338 | Tragic 84.6% |
| Salvadorans | 0.0 /100 | #339 | Tragic 84.5% |
| Mexicans | 0.0 /100 | #340 | Tragic 84.1% |
| Immigrants | Guatemala | 0.0 /100 | #341 | Tragic 84.0% |
| Houma | 0.0 /100 | #342 | Tragic 83.7% |
| Immigrants | El Salvador | 0.0 /100 | #343 | Tragic 83.6% |
| Immigrants | Central America | 0.0 /100 | #344 | Tragic 83.0% |
| Spanish American Indians | 0.0 /100 | #345 | Tragic 82.9% |
| Yakama | 0.0 /100 | #346 | Tragic 82.5% |
| Immigrants | Mexico | 0.0 /100 | #347 | Tragic 82.4% |
Demographics Similar to Israelis by 12th Grade, No Diploma
In terms of 12th grade, no diploma, the demographic groups most similar to Israelis are Immigrants from Hungary (92.1%, a difference of 0.020%), Palestinian (92.1%, a difference of 0.020%), Immigrants from Greece (92.1%, a difference of 0.020%), Immigrants from Zimbabwe (92.1%, a difference of 0.030%), and Yugoslavian (92.1%, a difference of 0.030%).
| Demographics | Rating | Rank | 12th Grade, No Diploma |
| Immigrants | Belarus | 97.4 /100 | #105 | Exceptional 92.2% |
| Immigrants | Russia | 97.3 /100 | #106 | Exceptional 92.2% |
| Syrians | 97.2 /100 | #107 | Exceptional 92.2% |
| Jordanians | 97.2 /100 | #108 | Exceptional 92.2% |
| Immigrants | Hungary | 97.0 /100 | #109 | Exceptional 92.1% |
| Palestinians | 97.0 /100 | #110 | Exceptional 92.1% |
| Immigrants | Greece | 96.9 /100 | #111 | Exceptional 92.1% |
| Israelis | 96.8 /100 | #112 | Exceptional 92.1% |
| Immigrants | Zimbabwe | 96.5 /100 | #113 | Exceptional 92.1% |
| Yugoslavians | 96.5 /100 | #114 | Exceptional 92.1% |
| Immigrants | Sri Lanka | 96.4 /100 | #115 | Exceptional 92.1% |
| Aleuts | 96.3 /100 | #116 | Exceptional 92.1% |
| Immigrants | Eastern Europe | 96.3 /100 | #117 | Exceptional 92.1% |
| Puget Sound Salish | 95.8 /100 | #118 | Exceptional 92.0% |
| Immigrants | Germany | 95.5 /100 | #119 | Exceptional 92.0% |