British West Indian vs Israeli 12th Grade, No Diploma
COMPARE
British West Indian
Israeli
12th Grade, No Diploma
12th Grade, No Diploma Comparison
British West Indians
Israelis
88.5%
12TH GRADE, NO DIPLOMA
0.0/ 100
METRIC RATING
290th/ 347
METRIC RANK
92.1%
12TH GRADE, NO DIPLOMA
96.8/ 100
METRIC RATING
112th/ 347
METRIC RANK
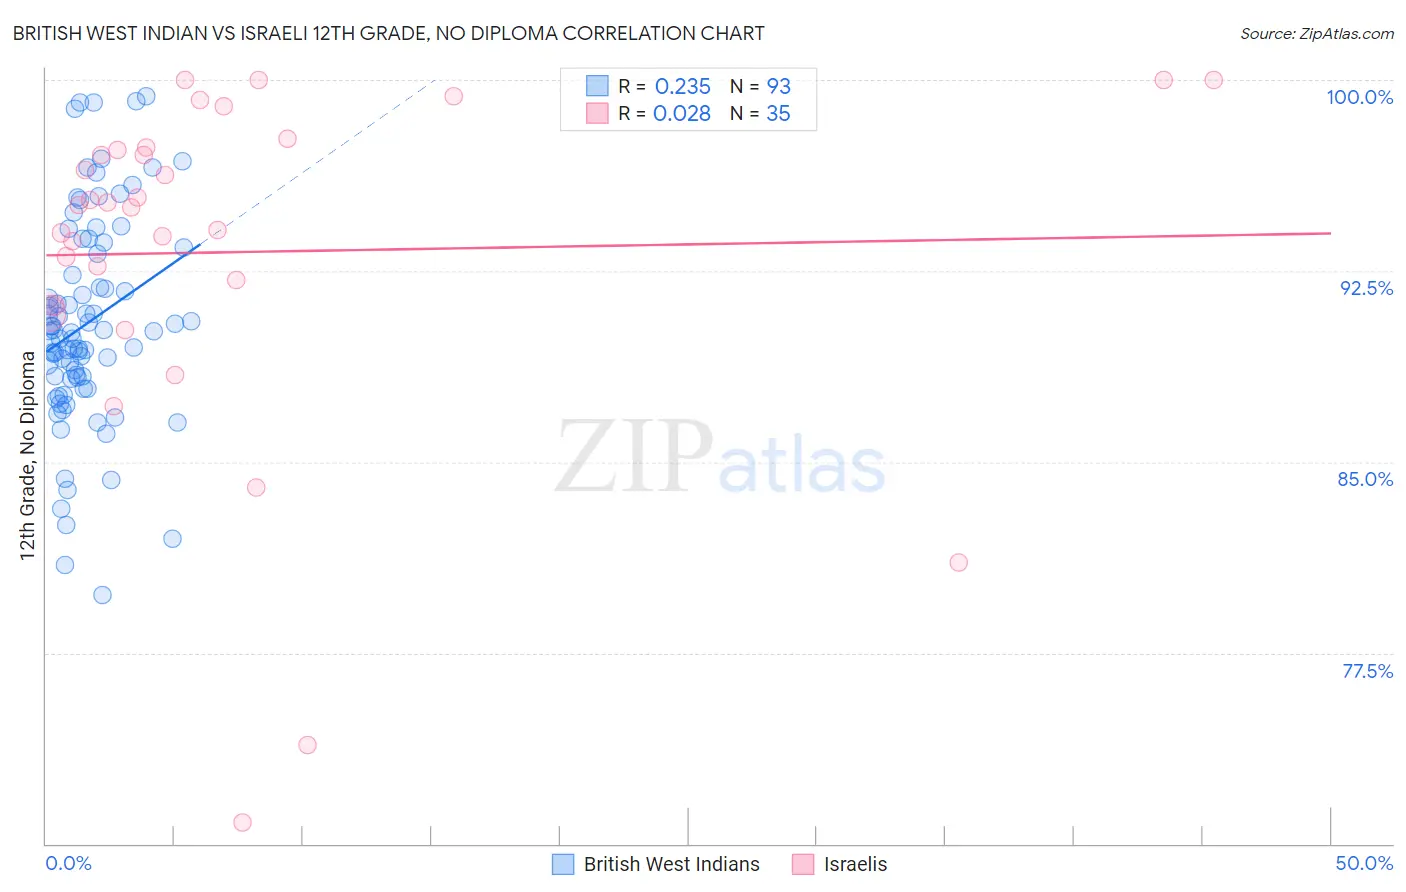
British West Indian vs Israeli 12th Grade, No Diploma Correlation Chart
The statistical analysis conducted on geographies consisting of 152,698,597 people shows a weak positive correlation between the proportion of British West Indians and percentage of population with at least 12th grade (no diploma) education in the United States with a correlation coefficient (R) of 0.235 and weighted average of 88.5%. Similarly, the statistical analysis conducted on geographies consisting of 211,220,151 people shows no correlation between the proportion of Israelis and percentage of population with at least 12th grade (no diploma) education in the United States with a correlation coefficient (R) of 0.028 and weighted average of 92.1%, a difference of 4.0%.
12th Grade, No Diploma Correlation Summary
| Measurement | British West Indian | Israeli |
| Minimum | 79.8% | 70.8% |
| Maximum | 99.4% | 100.0% |
| Range | 19.6% | 29.2% |
| Mean | 90.5% | 93.2% |
| Median | 90.1% | 95.1% |
| Interquartile 25% (IQ1) | 88.3% | 91.2% |
| Interquartile 75% (IQ3) | 93.3% | 97.4% |
| Interquartile Range (IQR) | 5.0% | 6.2% |
| Standard Deviation (Sample) | 4.1% | 6.9% |
| Standard Deviation (Population) | 4.1% | 6.8% |
Similar Demographics by 12th Grade, No Diploma
Demographics Similar to British West Indians by 12th Grade, No Diploma
In terms of 12th grade, no diploma, the demographic groups most similar to British West Indians are Dutch West Indian (88.5%, a difference of 0.0%), Haitian (88.5%, a difference of 0.0%), Immigrants from Fiji (88.6%, a difference of 0.10%), Hopi (88.6%, a difference of 0.11%), and Indonesian (88.6%, a difference of 0.12%).
| Demographics | Rating | Rank | 12th Grade, No Diploma |
| Paiute | 0.0 /100 | #283 | Tragic 88.7% |
| Pennsylvania Germans | 0.0 /100 | #284 | Tragic 88.7% |
| Indonesians | 0.0 /100 | #285 | Tragic 88.6% |
| Immigrants | West Indies | 0.0 /100 | #286 | Tragic 88.6% |
| Hopi | 0.0 /100 | #287 | Tragic 88.6% |
| Immigrants | Fiji | 0.0 /100 | #288 | Tragic 88.6% |
| Dutch West Indians | 0.0 /100 | #289 | Tragic 88.5% |
| British West Indians | 0.0 /100 | #290 | Tragic 88.5% |
| Haitians | 0.0 /100 | #291 | Tragic 88.5% |
| Immigrants | Grenada | 0.0 /100 | #292 | Tragic 88.4% |
| Japanese | 0.0 /100 | #293 | Tragic 88.3% |
| Guyanese | 0.0 /100 | #294 | Tragic 88.3% |
| Immigrants | Immigrants | 0.0 /100 | #295 | Tragic 88.2% |
| Fijians | 0.0 /100 | #296 | Tragic 88.2% |
| Pueblo | 0.0 /100 | #297 | Tragic 88.2% |
Demographics Similar to Israelis by 12th Grade, No Diploma
In terms of 12th grade, no diploma, the demographic groups most similar to Israelis are Immigrants from Hungary (92.1%, a difference of 0.020%), Palestinian (92.1%, a difference of 0.020%), Immigrants from Greece (92.1%, a difference of 0.020%), Immigrants from Zimbabwe (92.1%, a difference of 0.030%), and Yugoslavian (92.1%, a difference of 0.030%).
| Demographics | Rating | Rank | 12th Grade, No Diploma |
| Immigrants | Belarus | 97.4 /100 | #105 | Exceptional 92.2% |
| Immigrants | Russia | 97.3 /100 | #106 | Exceptional 92.2% |
| Syrians | 97.2 /100 | #107 | Exceptional 92.2% |
| Jordanians | 97.2 /100 | #108 | Exceptional 92.2% |
| Immigrants | Hungary | 97.0 /100 | #109 | Exceptional 92.1% |
| Palestinians | 97.0 /100 | #110 | Exceptional 92.1% |
| Immigrants | Greece | 96.9 /100 | #111 | Exceptional 92.1% |
| Israelis | 96.8 /100 | #112 | Exceptional 92.1% |
| Immigrants | Zimbabwe | 96.5 /100 | #113 | Exceptional 92.1% |
| Yugoslavians | 96.5 /100 | #114 | Exceptional 92.1% |
| Immigrants | Sri Lanka | 96.4 /100 | #115 | Exceptional 92.1% |
| Aleuts | 96.3 /100 | #116 | Exceptional 92.1% |
| Immigrants | Eastern Europe | 96.3 /100 | #117 | Exceptional 92.1% |
| Puget Sound Salish | 95.8 /100 | #118 | Exceptional 92.0% |
| Immigrants | Germany | 95.5 /100 | #119 | Exceptional 92.0% |