Hopi vs Portuguese GED/Equivalency
COMPARE
Hopi
Portuguese
GED/Equivalency
GED/Equivalency Comparison
Hopi
Portuguese
83.0%
GED/EQUIVALENCY
0.2/ 100
METRIC RATING
269th/ 347
METRIC RANK
85.0%
GED/EQUIVALENCY
15.9/ 100
METRIC RATING
201st/ 347
METRIC RANK
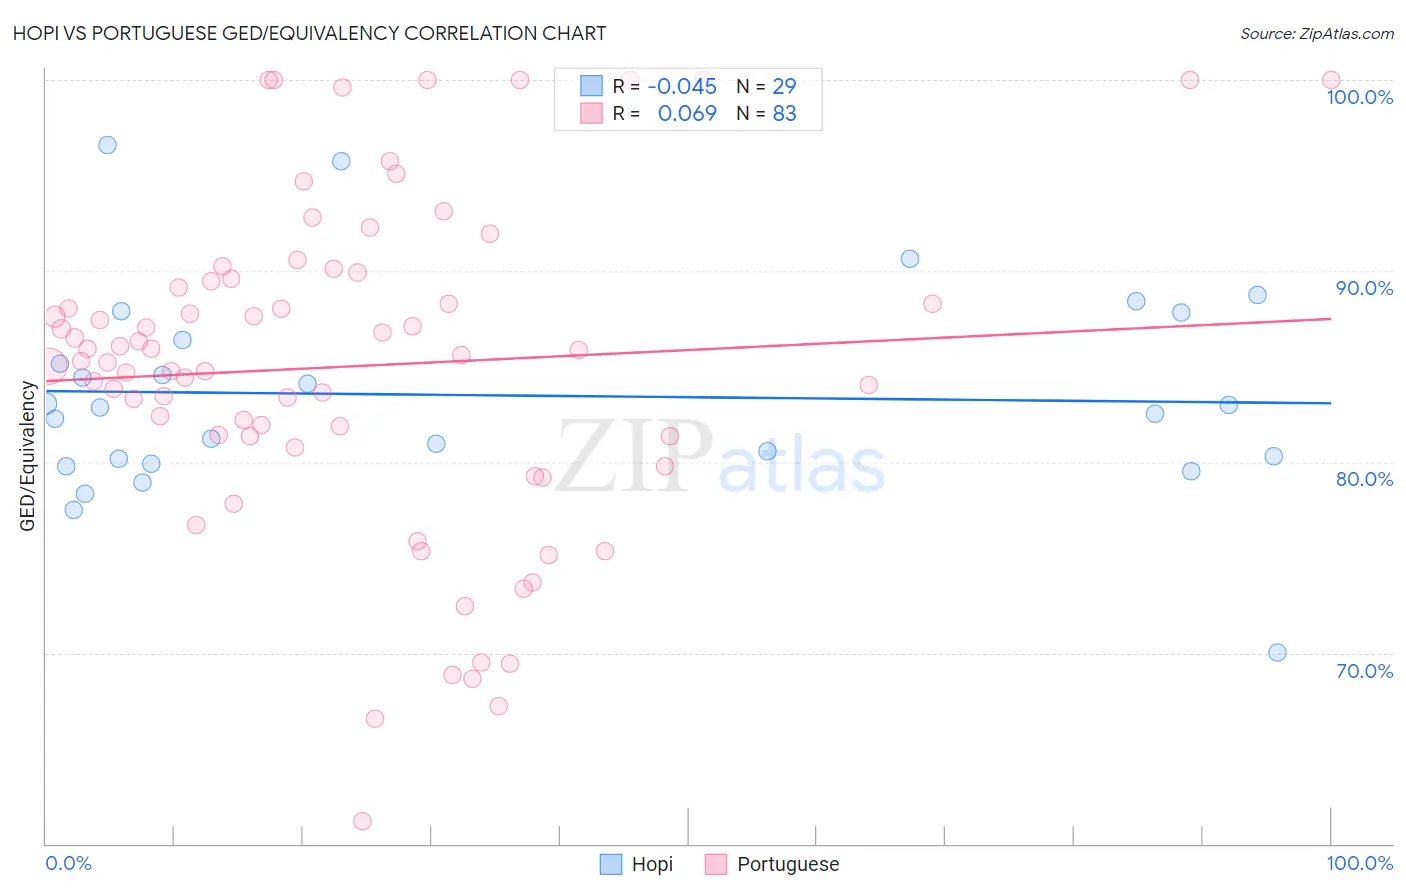
Hopi vs Portuguese GED/Equivalency Correlation Chart
The statistical analysis conducted on geographies consisting of 74,739,957 people shows no correlation between the proportion of Hopi and percentage of population with at least ged/equivalency education in the United States with a correlation coefficient (R) of -0.045 and weighted average of 83.0%. Similarly, the statistical analysis conducted on geographies consisting of 450,368,110 people shows a slight positive correlation between the proportion of Portuguese and percentage of population with at least ged/equivalency education in the United States with a correlation coefficient (R) of 0.069 and weighted average of 85.0%, a difference of 2.5%.
GED/Equivalency Correlation Summary
| Measurement | Hopi | Portuguese |
| Minimum | 70.0% | 61.2% |
| Maximum | 96.6% | 100.0% |
| Range | 26.5% | 38.8% |
| Mean | 83.5% | 85.0% |
| Median | 82.8% | 85.6% |
| Interquartile 25% (IQ1) | 80.0% | 81.3% |
| Interquartile 75% (IQ3) | 87.1% | 89.6% |
| Interquartile Range (IQR) | 7.1% | 8.3% |
| Standard Deviation (Sample) | 5.4% | 8.7% |
| Standard Deviation (Population) | 5.3% | 8.6% |
Similar Demographics by GED/Equivalency
Demographics Similar to Hopi by GED/Equivalency
In terms of ged/equivalency, the demographic groups most similar to Hopi are Immigrants from Burma/Myanmar (83.0%, a difference of 0.040%), Immigrants from Jamaica (82.9%, a difference of 0.050%), Trinidadian and Tobagonian (83.0%, a difference of 0.080%), U.S. Virgin Islander (82.9%, a difference of 0.090%), and Kiowa (83.1%, a difference of 0.10%).
| Demographics | Rating | Rank | GED/Equivalency |
| Immigrants | Armenia | 0.2 /100 | #262 | Tragic 83.1% |
| Immigrants | Congo | 0.2 /100 | #263 | Tragic 83.1% |
| Bangladeshis | 0.2 /100 | #264 | Tragic 83.1% |
| West Indians | 0.2 /100 | #265 | Tragic 83.1% |
| Kiowa | 0.2 /100 | #266 | Tragic 83.1% |
| Trinidadians and Tobagonians | 0.2 /100 | #267 | Tragic 83.0% |
| Immigrants | Burma/Myanmar | 0.2 /100 | #268 | Tragic 83.0% |
| Hopi | 0.2 /100 | #269 | Tragic 83.0% |
| Immigrants | Jamaica | 0.2 /100 | #270 | Tragic 82.9% |
| U.S. Virgin Islanders | 0.2 /100 | #271 | Tragic 82.9% |
| Barbadians | 0.1 /100 | #272 | Tragic 82.9% |
| Pennsylvania Germans | 0.1 /100 | #273 | Tragic 82.9% |
| Immigrants | Trinidad and Tobago | 0.1 /100 | #274 | Tragic 82.8% |
| Seminole | 0.1 /100 | #275 | Tragic 82.8% |
| Blacks/African Americans | 0.1 /100 | #276 | Tragic 82.8% |
Demographics Similar to Portuguese by GED/Equivalency
In terms of ged/equivalency, the demographic groups most similar to Portuguese are Uruguayan (85.0%, a difference of 0.0%), Cree (85.0%, a difference of 0.0%), Somali (85.0%, a difference of 0.020%), Panamanian (85.0%, a difference of 0.020%), and Hawaiian (85.0%, a difference of 0.030%).
| Demographics | Rating | Rank | GED/Equivalency |
| Puget Sound Salish | 20.8 /100 | #194 | Fair 85.2% |
| Chippewa | 20.8 /100 | #195 | Fair 85.2% |
| Tongans | 20.7 /100 | #196 | Fair 85.2% |
| Costa Ricans | 20.4 /100 | #197 | Fair 85.2% |
| Immigrants | Africa | 17.5 /100 | #198 | Poor 85.1% |
| Somalis | 16.4 /100 | #199 | Poor 85.0% |
| Uruguayans | 16.0 /100 | #200 | Poor 85.0% |
| Portuguese | 15.9 /100 | #201 | Poor 85.0% |
| Cree | 15.9 /100 | #202 | Poor 85.0% |
| Panamanians | 15.3 /100 | #203 | Poor 85.0% |
| Hawaiians | 15.2 /100 | #204 | Poor 85.0% |
| Liberians | 14.6 /100 | #205 | Poor 85.0% |
| Samoans | 13.7 /100 | #206 | Poor 84.9% |
| Hmong | 13.1 /100 | #207 | Poor 84.9% |
| Marshallese | 12.5 /100 | #208 | Poor 84.9% |