Ottawa vs Immigrants from Switzerland 11th Grade
COMPARE
Ottawa
Immigrants from Switzerland
11th Grade
11th Grade Comparison
Ottawa
Immigrants from Switzerland
93.6%
11TH GRADE
99.2/ 100
METRIC RATING
90th/ 347
METRIC RANK
93.6%
11TH GRADE
99.3/ 100
METRIC RATING
85th/ 347
METRIC RANK
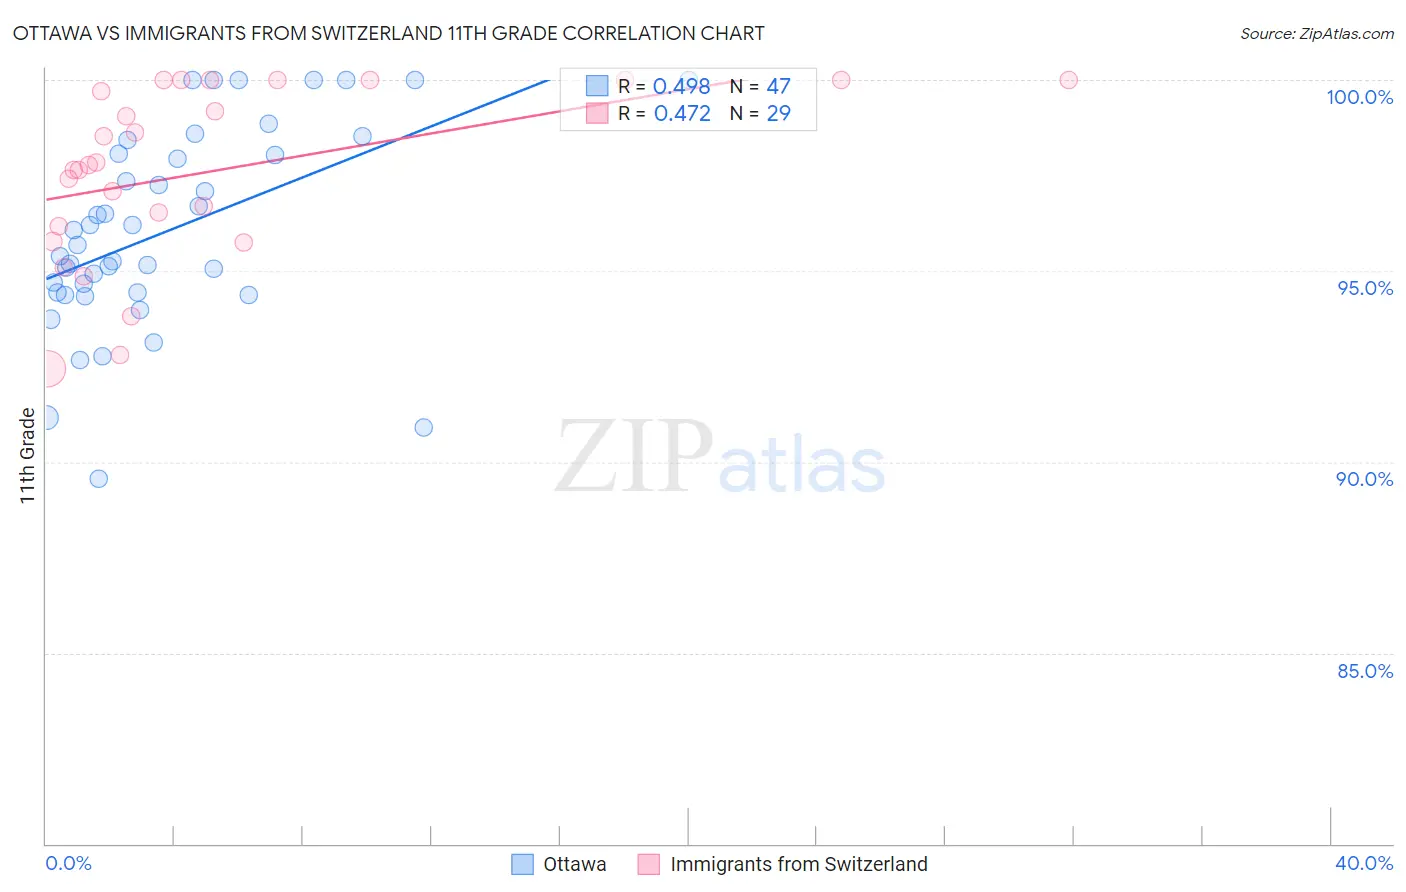
Ottawa vs Immigrants from Switzerland 11th Grade Correlation Chart
The statistical analysis conducted on geographies consisting of 49,956,602 people shows a moderate positive correlation between the proportion of Ottawa and percentage of population with at least 11th grade education in the United States with a correlation coefficient (R) of 0.498 and weighted average of 93.6%. Similarly, the statistical analysis conducted on geographies consisting of 148,082,451 people shows a moderate positive correlation between the proportion of Immigrants from Switzerland and percentage of population with at least 11th grade education in the United States with a correlation coefficient (R) of 0.472 and weighted average of 93.6%, a difference of 0.020%.
11th Grade Correlation Summary
| Measurement | Ottawa | Immigrants from Switzerland |
| Minimum | 89.6% | 92.4% |
| Maximum | 100.0% | 100.0% |
| Range | 10.4% | 7.6% |
| Mean | 96.1% | 97.6% |
| Median | 95.7% | 97.8% |
| Interquartile 25% (IQ1) | 94.4% | 96.0% |
| Interquartile 75% (IQ3) | 98.1% | 100.0% |
| Interquartile Range (IQR) | 3.6% | 4.0% |
| Standard Deviation (Sample) | 2.6% | 2.3% |
| Standard Deviation (Population) | 2.6% | 2.2% |
Demographics Similar to Ottawa and Immigrants from Switzerland by 11th Grade
In terms of 11th grade, the demographic groups most similar to Ottawa are Immigrants from South Central Asia (93.6%, a difference of 0.010%), Immigrants from Western Europe (93.6%, a difference of 0.010%), Cambodian (93.6%, a difference of 0.010%), Burmese (93.6%, a difference of 0.010%), and South African (93.6%, a difference of 0.010%). Similarly, the demographic groups most similar to Immigrants from Switzerland are Immigrants from Taiwan (93.6%, a difference of 0.0%), Icelander (93.6%, a difference of 0.010%), Immigrants from South Central Asia (93.6%, a difference of 0.010%), Immigrants from Western Europe (93.6%, a difference of 0.010%), and Cambodian (93.6%, a difference of 0.010%).
| Demographics | Rating | Rank | 11th Grade |
| Aleuts | 99.5 /100 | #77 | Exceptional 93.7% |
| Soviet Union | 99.5 /100 | #78 | Exceptional 93.7% |
| Immigrants | Denmark | 99.5 /100 | #79 | Exceptional 93.7% |
| Canadians | 99.5 /100 | #80 | Exceptional 93.7% |
| Immigrants | Moldova | 99.5 /100 | #81 | Exceptional 93.7% |
| Immigrants | Saudi Arabia | 99.3 /100 | #82 | Exceptional 93.7% |
| Icelanders | 99.3 /100 | #83 | Exceptional 93.6% |
| Immigrants | Taiwan | 99.3 /100 | #84 | Exceptional 93.6% |
| Immigrants | Switzerland | 99.3 /100 | #85 | Exceptional 93.6% |
| Immigrants | South Central Asia | 99.2 /100 | #86 | Exceptional 93.6% |
| Immigrants | Western Europe | 99.2 /100 | #87 | Exceptional 93.6% |
| Cambodians | 99.2 /100 | #88 | Exceptional 93.6% |
| Burmese | 99.2 /100 | #89 | Exceptional 93.6% |
| Ottawa | 99.2 /100 | #90 | Exceptional 93.6% |
| South Africans | 99.2 /100 | #91 | Exceptional 93.6% |
| Immigrants | Bulgaria | 99.1 /100 | #92 | Exceptional 93.6% |
| Puget Sound Salish | 99.1 /100 | #93 | Exceptional 93.6% |
| Swiss | 99.0 /100 | #94 | Exceptional 93.6% |
| Immigrants | France | 99.0 /100 | #95 | Exceptional 93.6% |
| Immigrants | Turkey | 98.9 /100 | #96 | Exceptional 93.5% |
| Immigrants | Iran | 98.9 /100 | #97 | Exceptional 93.5% |