Honduran vs Slovene 3rd Grade
COMPARE
Honduran
Slovene
3rd Grade
3rd Grade Comparison
Hondurans
Slovenes
96.5%
3RD GRADE
0.0/ 100
METRIC RATING
323rd/ 347
METRIC RANK
98.6%
3RD GRADE
100.0/ 100
METRIC RATING
11th/ 347
METRIC RANK
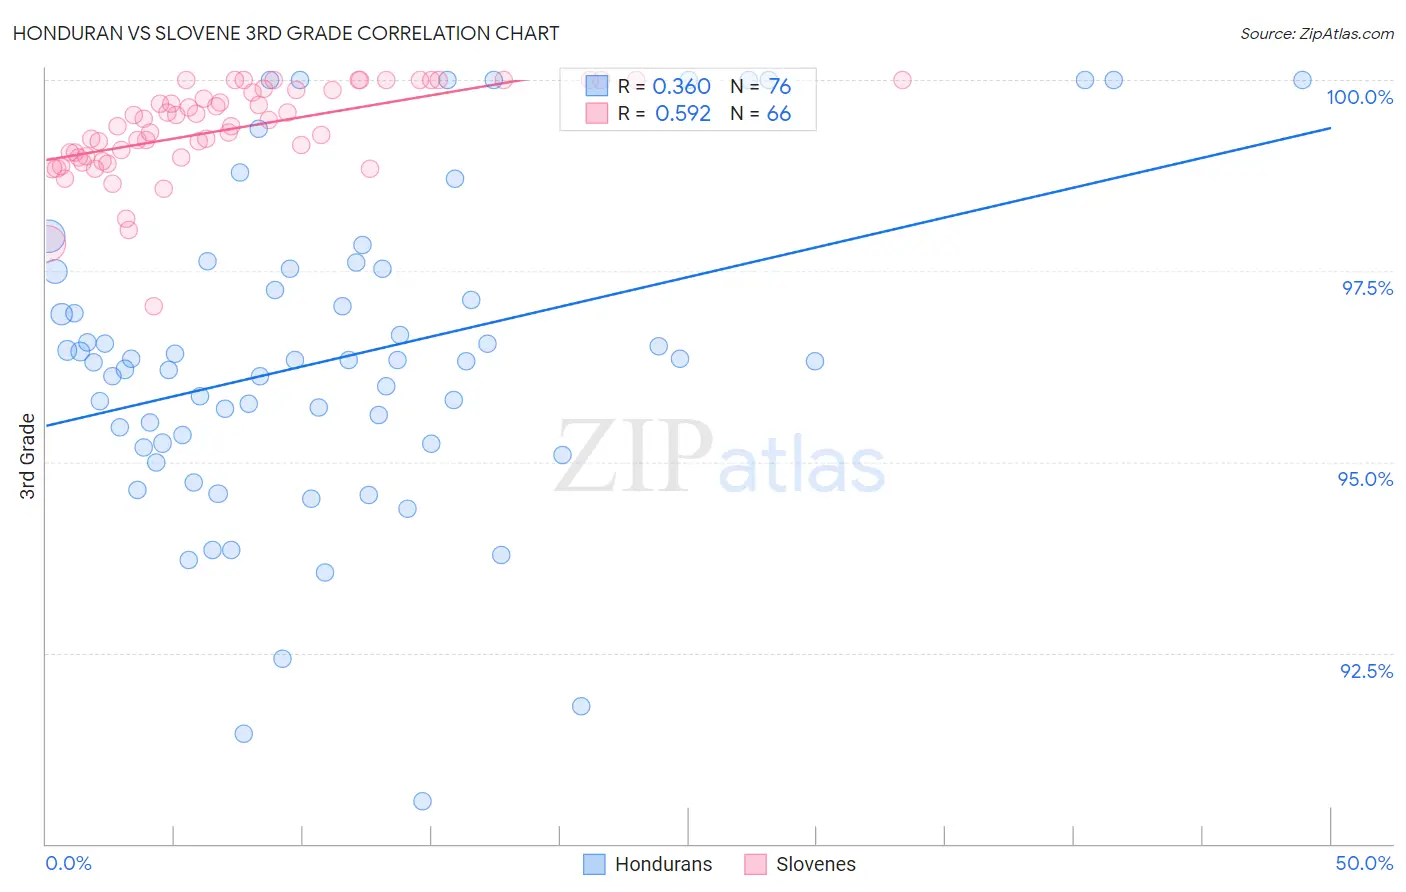
Honduran vs Slovene 3rd Grade Correlation Chart
The statistical analysis conducted on geographies consisting of 357,784,803 people shows a mild positive correlation between the proportion of Hondurans and percentage of population with at least 3rd grade education in the United States with a correlation coefficient (R) of 0.360 and weighted average of 96.5%. Similarly, the statistical analysis conducted on geographies consisting of 261,353,374 people shows a substantial positive correlation between the proportion of Slovenes and percentage of population with at least 3rd grade education in the United States with a correlation coefficient (R) of 0.592 and weighted average of 98.6%, a difference of 2.2%.
3rd Grade Correlation Summary
| Measurement | Honduran | Slovene |
| Minimum | 90.6% | 97.0% |
| Maximum | 100.0% | 100.0% |
| Range | 9.4% | 3.0% |
| Mean | 96.4% | 99.4% |
| Median | 96.3% | 99.4% |
| Interquartile 25% (IQ1) | 95.2% | 99.0% |
| Interquartile 75% (IQ3) | 97.5% | 99.9% |
| Interquartile Range (IQR) | 2.3% | 0.88% |
| Standard Deviation (Sample) | 2.1% | 0.60% |
| Standard Deviation (Population) | 2.1% | 0.59% |
Similar Demographics by 3rd Grade
Demographics Similar to Hondurans by 3rd Grade
In terms of 3rd grade, the demographic groups most similar to Hondurans are Immigrants from Nicaragua (96.5%, a difference of 0.020%), Indonesian (96.5%, a difference of 0.020%), Immigrants from Belize (96.5%, a difference of 0.020%), Vietnamese (96.5%, a difference of 0.040%), and Hispanic or Latino (96.5%, a difference of 0.050%).
| Demographics | Rating | Rank | 3rd Grade |
| Immigrants | Burma/Myanmar | 0.0 /100 | #316 | Tragic 96.6% |
| Immigrants | Bangladesh | 0.0 /100 | #317 | Tragic 96.6% |
| Hispanics or Latinos | 0.0 /100 | #318 | Tragic 96.5% |
| Vietnamese | 0.0 /100 | #319 | Tragic 96.5% |
| Immigrants | Nicaragua | 0.0 /100 | #320 | Tragic 96.5% |
| Indonesians | 0.0 /100 | #321 | Tragic 96.5% |
| Immigrants | Belize | 0.0 /100 | #322 | Tragic 96.5% |
| Hondurans | 0.0 /100 | #323 | Tragic 96.5% |
| Dominicans | 0.0 /100 | #324 | Tragic 96.4% |
| Mexican American Indians | 0.0 /100 | #325 | Tragic 96.4% |
| Immigrants | Vietnam | 0.0 /100 | #326 | Tragic 96.4% |
| Japanese | 0.0 /100 | #327 | Tragic 96.4% |
| Bangladeshis | 0.0 /100 | #328 | Tragic 96.3% |
| Immigrants | Honduras | 0.0 /100 | #329 | Tragic 96.3% |
| Immigrants | Armenia | 0.0 /100 | #330 | Tragic 96.3% |
Demographics Similar to Slovenes by 3rd Grade
In terms of 3rd grade, the demographic groups most similar to Slovenes are Alaska Native (98.6%, a difference of 0.0%), English (98.6%, a difference of 0.020%), Tlingit-Haida (98.5%, a difference of 0.020%), Carpatho Rusyn (98.5%, a difference of 0.020%), and Slovak (98.6%, a difference of 0.030%).
| Demographics | Rating | Rank | 3rd Grade |
| Inupiat | 100.0 /100 | #4 | Exceptional 98.8% |
| Tsimshian | 100.0 /100 | #5 | Exceptional 98.8% |
| Alaskan Athabascans | 100.0 /100 | #6 | Exceptional 98.7% |
| Norwegians | 100.0 /100 | #7 | Exceptional 98.6% |
| Slovaks | 100.0 /100 | #8 | Exceptional 98.6% |
| Germans | 100.0 /100 | #9 | Exceptional 98.6% |
| Alaska Natives | 100.0 /100 | #10 | Exceptional 98.6% |
| Slovenes | 100.0 /100 | #11 | Exceptional 98.6% |
| English | 100.0 /100 | #12 | Exceptional 98.6% |
| Tlingit-Haida | 100.0 /100 | #13 | Exceptional 98.5% |
| Carpatho Rusyns | 100.0 /100 | #14 | Exceptional 98.5% |
| Swedes | 100.0 /100 | #15 | Exceptional 98.5% |
| Scottish | 100.0 /100 | #16 | Exceptional 98.5% |
| Dutch | 100.0 /100 | #17 | Exceptional 98.5% |
| Irish | 100.0 /100 | #18 | Exceptional 98.5% |