Honduran vs Slovene Male Poverty
COMPARE
Honduran
Slovene
Male Poverty
Male Poverty Comparison
Hondurans
Slovenes
14.3%
MALE POVERTY
0.0/ 100
METRIC RATING
311th/ 347
METRIC RANK
10.0%
MALE POVERTY
98.8/ 100
METRIC RATING
49th/ 347
METRIC RANK
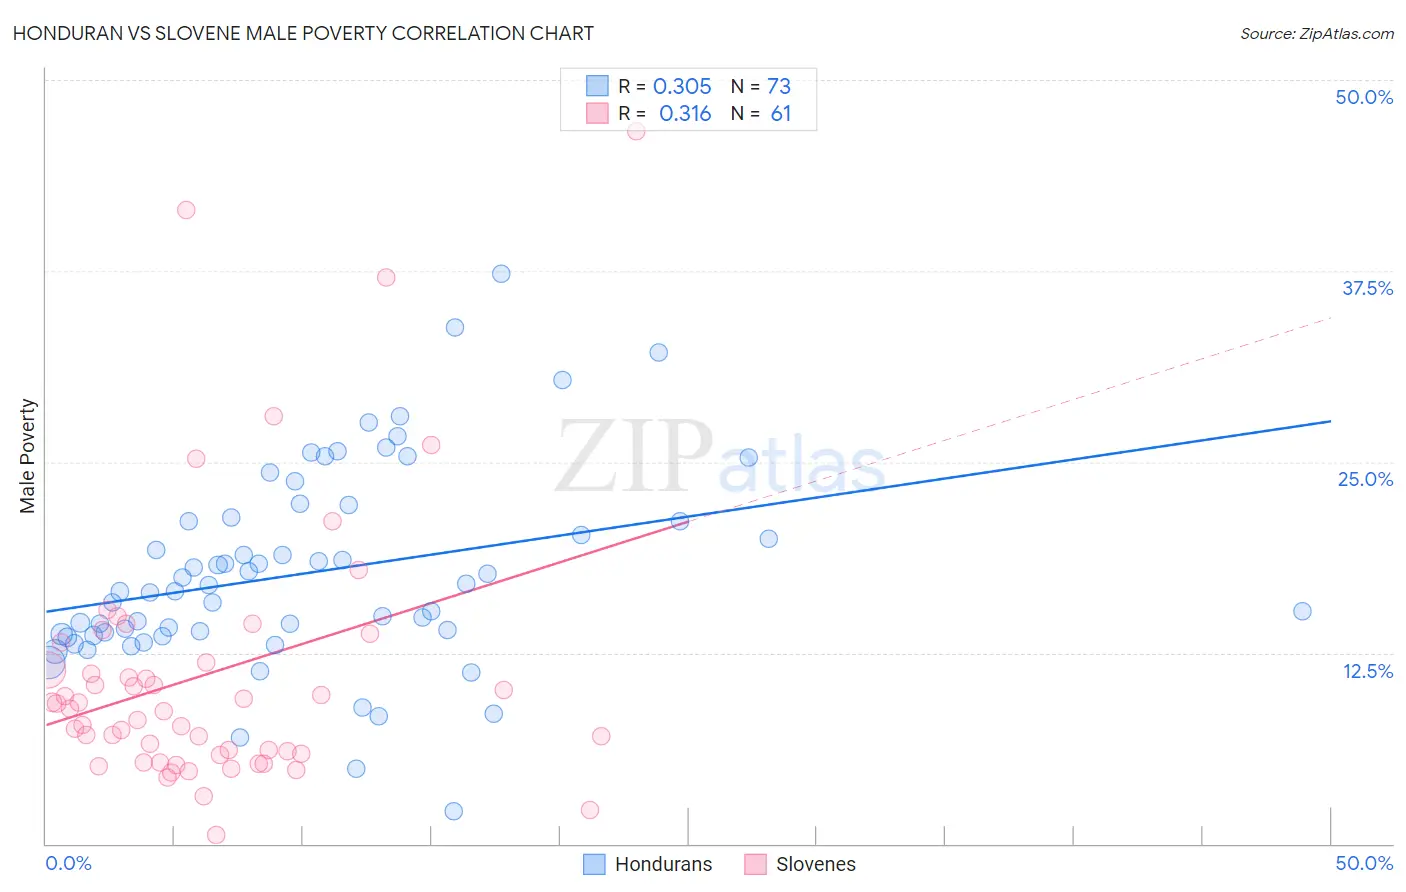
Honduran vs Slovene Male Poverty Correlation Chart
The statistical analysis conducted on geographies consisting of 357,543,149 people shows a mild positive correlation between the proportion of Hondurans and poverty level among males in the United States with a correlation coefficient (R) of 0.305 and weighted average of 14.3%. Similarly, the statistical analysis conducted on geographies consisting of 261,189,705 people shows a mild positive correlation between the proportion of Slovenes and poverty level among males in the United States with a correlation coefficient (R) of 0.316 and weighted average of 10.0%, a difference of 43.4%.
Male Poverty Correlation Summary
| Measurement | Honduran | Slovene |
| Minimum | 2.2% | 0.61% |
| Maximum | 37.3% | 46.7% |
| Range | 35.2% | 46.1% |
| Mean | 17.7% | 11.1% |
| Median | 16.5% | 8.8% |
| Interquartile 25% (IQ1) | 13.7% | 5.8% |
| Interquartile 75% (IQ3) | 21.3% | 12.5% |
| Interquartile Range (IQR) | 7.6% | 6.7% |
| Standard Deviation (Sample) | 6.5% | 8.9% |
| Standard Deviation (Population) | 6.5% | 8.8% |
Similar Demographics by Male Poverty
Demographics Similar to Hondurans by Male Poverty
In terms of male poverty, the demographic groups most similar to Hondurans are Seminole (14.3%, a difference of 0.21%), Somali (14.3%, a difference of 0.41%), Choctaw (14.4%, a difference of 0.47%), African (14.2%, a difference of 0.79%), and Dutch West Indian (14.2%, a difference of 0.81%).
| Demographics | Rating | Rank | Male Poverty |
| Senegalese | 0.0 /100 | #304 | Tragic 14.1% |
| Immigrants | Bangladesh | 0.0 /100 | #305 | Tragic 14.1% |
| Creek | 0.0 /100 | #306 | Tragic 14.1% |
| Dutch West Indians | 0.0 /100 | #307 | Tragic 14.2% |
| Africans | 0.0 /100 | #308 | Tragic 14.2% |
| Somalis | 0.0 /100 | #309 | Tragic 14.3% |
| Seminole | 0.0 /100 | #310 | Tragic 14.3% |
| Hondurans | 0.0 /100 | #311 | Tragic 14.3% |
| Choctaw | 0.0 /100 | #312 | Tragic 14.4% |
| Immigrants | Somalia | 0.0 /100 | #313 | Tragic 14.6% |
| Immigrants | Honduras | 0.0 /100 | #314 | Tragic 14.6% |
| Chippewa | 0.0 /100 | #315 | Tragic 14.6% |
| British West Indians | 0.0 /100 | #316 | Tragic 14.6% |
| Immigrants | Dominica | 0.0 /100 | #317 | Tragic 14.7% |
| Immigrants | Grenada | 0.0 /100 | #318 | Tragic 14.7% |
Demographics Similar to Slovenes by Male Poverty
In terms of male poverty, the demographic groups most similar to Slovenes are Immigrants from Philippines (10.0%, a difference of 0.050%), Immigrants from Singapore (10.0%, a difference of 0.090%), Immigrants from Japan (10.0%, a difference of 0.090%), Immigrants from Croatia (10.0%, a difference of 0.16%), and Turkish (10.0%, a difference of 0.23%).
| Demographics | Rating | Rank | Male Poverty |
| Immigrants | Iran | 99.1 /100 | #42 | Exceptional 9.9% |
| Immigrants | Moldova | 99.0 /100 | #43 | Exceptional 9.9% |
| Immigrants | Romania | 98.9 /100 | #44 | Exceptional 9.9% |
| Immigrants | Serbia | 98.9 /100 | #45 | Exceptional 10.0% |
| Turks | 98.9 /100 | #46 | Exceptional 10.0% |
| Immigrants | Singapore | 98.8 /100 | #47 | Exceptional 10.0% |
| Immigrants | Japan | 98.8 /100 | #48 | Exceptional 10.0% |
| Slovenes | 98.8 /100 | #49 | Exceptional 10.0% |
| Immigrants | Philippines | 98.7 /100 | #50 | Exceptional 10.0% |
| Immigrants | Croatia | 98.7 /100 | #51 | Exceptional 10.0% |
| Asians | 98.7 /100 | #52 | Exceptional 10.0% |
| Immigrants | Czechoslovakia | 98.6 /100 | #53 | Exceptional 10.0% |
| Immigrants | Austria | 98.5 /100 | #54 | Exceptional 10.0% |
| Germans | 98.3 /100 | #55 | Exceptional 10.1% |
| Immigrants | Bulgaria | 98.2 /100 | #56 | Exceptional 10.1% |