Honduran vs Israeli 11th Grade
COMPARE
Honduran
Israeli
11th Grade
11th Grade Comparison
Hondurans
Israelis
87.4%
11TH GRADE
0.0/ 100
METRIC RATING
330th/ 347
METRIC RANK
93.3%
11TH GRADE
97.0/ 100
METRIC RATING
119th/ 347
METRIC RANK
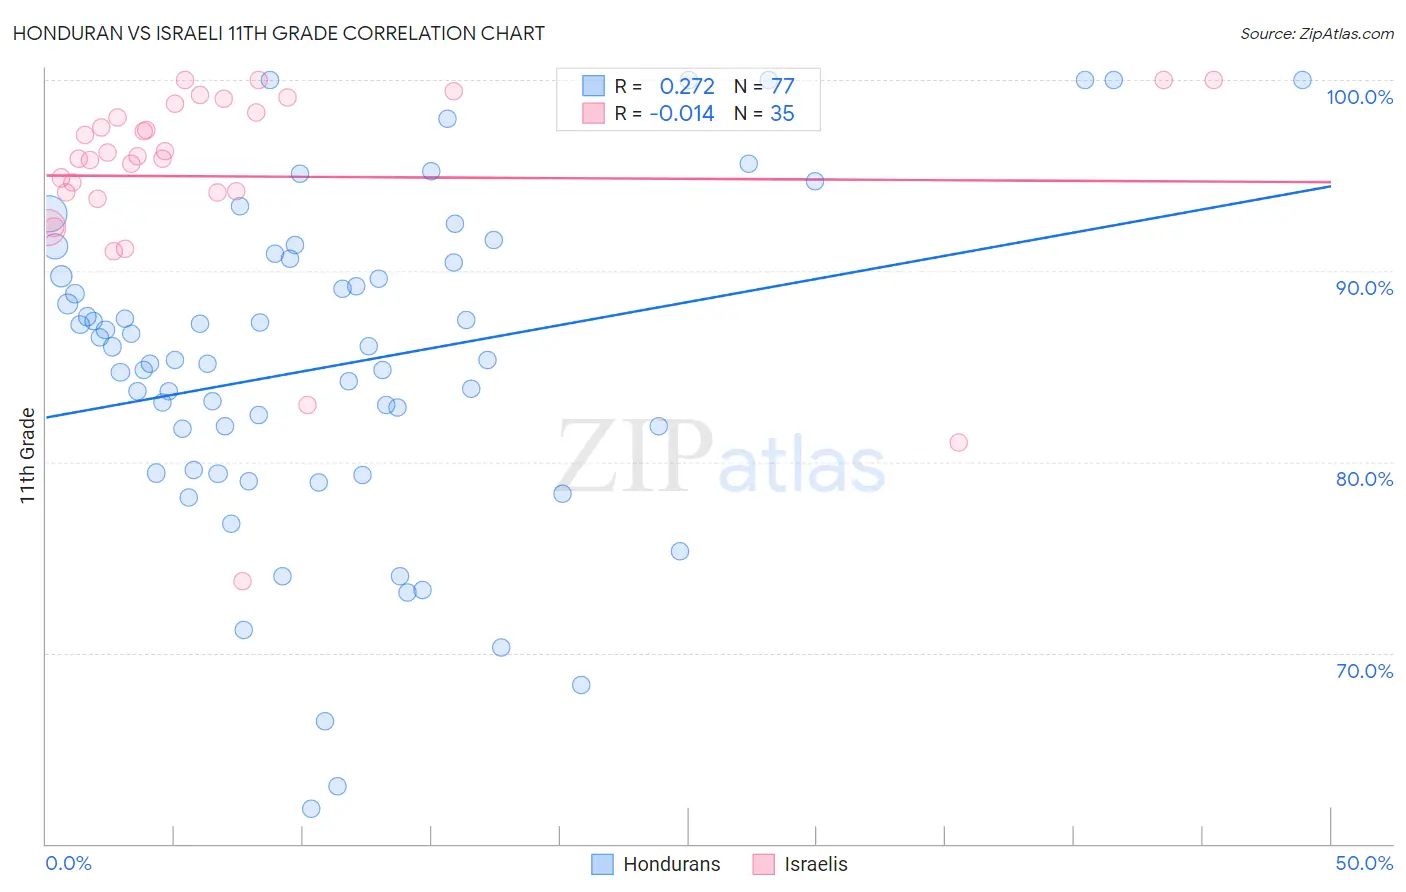
Honduran vs Israeli 11th Grade Correlation Chart
The statistical analysis conducted on geographies consisting of 357,858,827 people shows a weak positive correlation between the proportion of Hondurans and percentage of population with at least 11th grade education in the United States with a correlation coefficient (R) of 0.272 and weighted average of 87.4%. Similarly, the statistical analysis conducted on geographies consisting of 211,220,151 people shows no correlation between the proportion of Israelis and percentage of population with at least 11th grade education in the United States with a correlation coefficient (R) of -0.014 and weighted average of 93.3%, a difference of 6.8%.
11th Grade Correlation Summary
| Measurement | Honduran | Israeli |
| Minimum | 61.9% | 73.7% |
| Maximum | 100.0% | 100.0% |
| Range | 38.1% | 26.3% |
| Mean | 85.1% | 94.9% |
| Median | 85.4% | 96.0% |
| Interquartile 25% (IQ1) | 79.5% | 94.1% |
| Interquartile 75% (IQ3) | 90.5% | 98.8% |
| Interquartile Range (IQR) | 11.0% | 4.7% |
| Standard Deviation (Sample) | 8.6% | 5.6% |
| Standard Deviation (Population) | 8.5% | 5.5% |
Similar Demographics by 11th Grade
Demographics Similar to Hondurans by 11th Grade
In terms of 11th grade, the demographic groups most similar to Hondurans are Hispanic or Latino (87.3%, a difference of 0.060%), Immigrants from the Azores (87.2%, a difference of 0.16%), Mexican American Indian (87.5%, a difference of 0.19%), Tohono O'odham (87.6%, a difference of 0.26%), and Immigrants from Cabo Verde (87.6%, a difference of 0.31%).
| Demographics | Rating | Rank | 11th Grade |
| Pima | 0.0 /100 | #323 | Tragic 88.3% |
| Central American Indians | 0.0 /100 | #324 | Tragic 88.2% |
| Immigrants | Nicaragua | 0.0 /100 | #325 | Tragic 88.1% |
| Dominicans | 0.0 /100 | #326 | Tragic 87.7% |
| Immigrants | Cabo Verde | 0.0 /100 | #327 | Tragic 87.6% |
| Tohono O'odham | 0.0 /100 | #328 | Tragic 87.6% |
| Mexican American Indians | 0.0 /100 | #329 | Tragic 87.5% |
| Hondurans | 0.0 /100 | #330 | Tragic 87.4% |
| Hispanics or Latinos | 0.0 /100 | #331 | Tragic 87.3% |
| Immigrants | Azores | 0.0 /100 | #332 | Tragic 87.2% |
| Immigrants | Yemen | 0.0 /100 | #333 | Tragic 87.1% |
| Houma | 0.0 /100 | #334 | Tragic 87.0% |
| Central Americans | 0.0 /100 | #335 | Tragic 86.9% |
| Immigrants | Dominican Republic | 0.0 /100 | #336 | Tragic 86.9% |
| Immigrants | Honduras | 0.0 /100 | #337 | Tragic 86.9% |
Demographics Similar to Israelis by 11th Grade
In terms of 11th grade, the demographic groups most similar to Israelis are Immigrants from Korea (93.3%, a difference of 0.0%), Immigrants from Russia (93.3%, a difference of 0.030%), White/Caucasian (93.3%, a difference of 0.040%), Immigrants from Hungary (93.4%, a difference of 0.050%), and German Russian (93.3%, a difference of 0.050%).
| Demographics | Rating | Rank | 11th Grade |
| Immigrants | Germany | 98.0 /100 | #112 | Exceptional 93.4% |
| Immigrants | Zimbabwe | 97.8 /100 | #113 | Exceptional 93.4% |
| Jordanians | 97.8 /100 | #114 | Exceptional 93.4% |
| Palestinians | 97.7 /100 | #115 | Exceptional 93.4% |
| Immigrants | Hungary | 97.5 /100 | #116 | Exceptional 93.4% |
| Whites/Caucasians | 97.4 /100 | #117 | Exceptional 93.3% |
| Immigrants | Korea | 97.0 /100 | #118 | Exceptional 93.3% |
| Israelis | 97.0 /100 | #119 | Exceptional 93.3% |
| Immigrants | Russia | 96.6 /100 | #120 | Exceptional 93.3% |
| German Russians | 96.4 /100 | #121 | Exceptional 93.3% |
| Immigrants | Belarus | 96.3 /100 | #122 | Exceptional 93.3% |
| Immigrants | Greece | 95.9 /100 | #123 | Exceptional 93.2% |
| Immigrants | Eastern Europe | 95.9 /100 | #124 | Exceptional 93.2% |
| Immigrants | Sri Lanka | 95.6 /100 | #125 | Exceptional 93.2% |
| Basques | 95.2 /100 | #126 | Exceptional 93.2% |