Hmong vs Tlingit-Haida Kindergarten
COMPARE
Hmong
Tlingit-Haida
Kindergarten
Kindergarten Comparison
Hmong
Tlingit-Haida
98.1%
KINDERGARTEN
78.8/ 100
METRIC RATING
145th/ 347
METRIC RANK
98.7%
KINDERGARTEN
100.0/ 100
METRIC RATING
9th/ 347
METRIC RANK
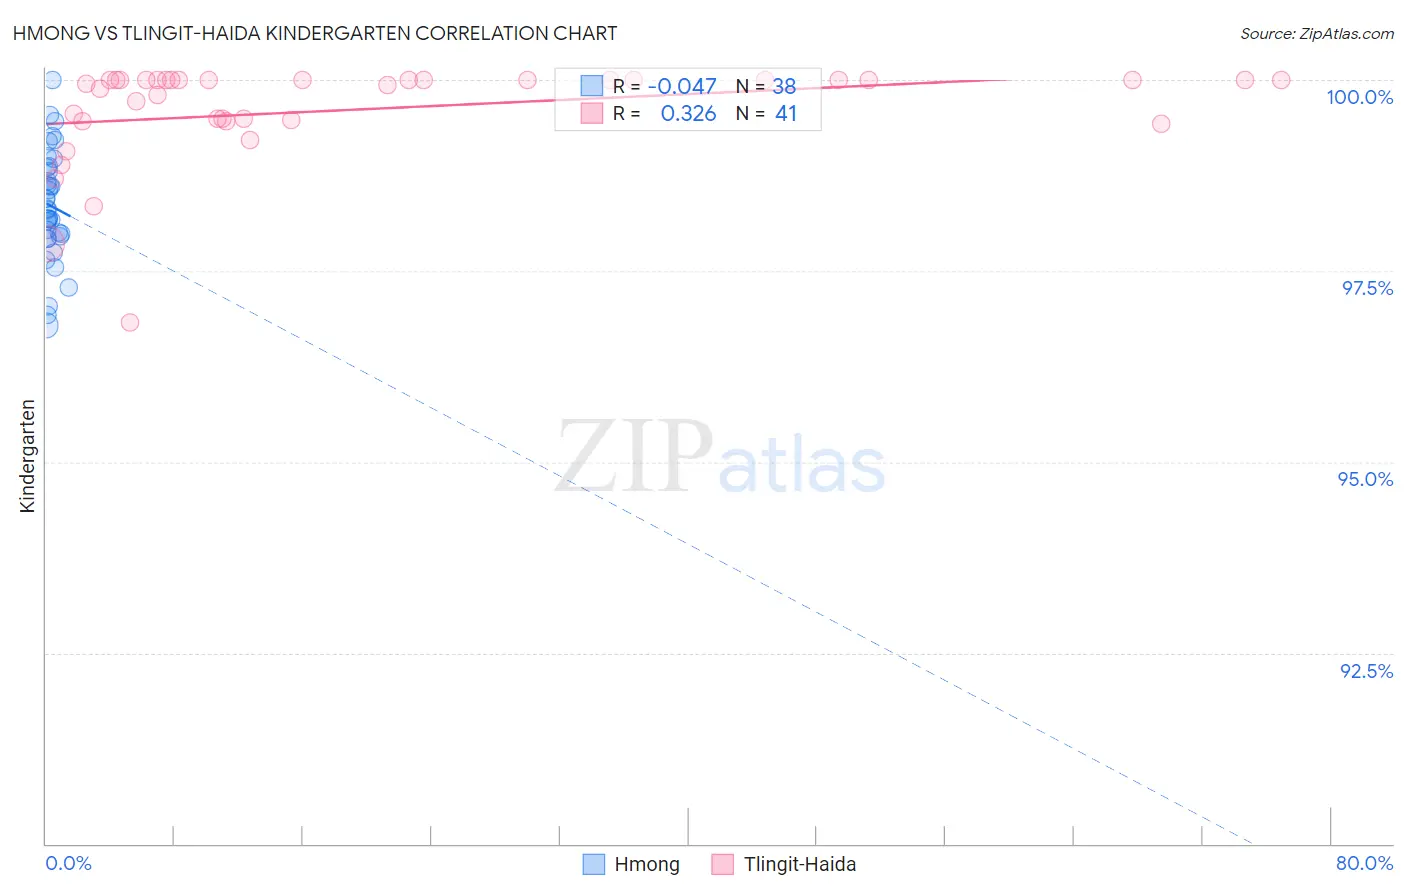
Hmong vs Tlingit-Haida Kindergarten Correlation Chart
The statistical analysis conducted on geographies consisting of 24,672,093 people shows no correlation between the proportion of Hmong and percentage of population with at least kindergarten education in the United States with a correlation coefficient (R) of -0.047 and weighted average of 98.1%. Similarly, the statistical analysis conducted on geographies consisting of 60,865,648 people shows a mild positive correlation between the proportion of Tlingit-Haida and percentage of population with at least kindergarten education in the United States with a correlation coefficient (R) of 0.326 and weighted average of 98.7%, a difference of 0.67%.
Kindergarten Correlation Summary
| Measurement | Hmong | Tlingit-Haida |
| Minimum | 96.8% | 96.8% |
| Maximum | 100.0% | 100.0% |
| Range | 3.2% | 3.2% |
| Mean | 98.4% | 99.6% |
| Median | 98.3% | 100.0% |
| Interquartile 25% (IQ1) | 98.0% | 99.5% |
| Interquartile 75% (IQ3) | 98.9% | 100.0% |
| Interquartile Range (IQR) | 0.90% | 0.53% |
| Standard Deviation (Sample) | 0.73% | 0.67% |
| Standard Deviation (Population) | 0.72% | 0.66% |
Similar Demographics by Kindergarten
Demographics Similar to Hmong by Kindergarten
In terms of kindergarten, the demographic groups most similar to Hmong are Filipino (98.0%, a difference of 0.0%), Burmese (98.1%, a difference of 0.010%), Alsatian (98.1%, a difference of 0.010%), Immigrants from Israel (98.0%, a difference of 0.010%), and Palestinian (98.1%, a difference of 0.020%).
| Demographics | Rating | Rank | Kindergarten |
| Immigrants | Romania | 87.7 /100 | #138 | Excellent 98.1% |
| Israelis | 87.7 /100 | #139 | Excellent 98.1% |
| Palestinians | 83.6 /100 | #140 | Excellent 98.1% |
| Marshallese | 83.0 /100 | #141 | Excellent 98.1% |
| Immigrants | Turkey | 82.8 /100 | #142 | Excellent 98.1% |
| Burmese | 81.5 /100 | #143 | Excellent 98.1% |
| Alsatians | 80.4 /100 | #144 | Excellent 98.1% |
| Hmong | 78.8 /100 | #145 | Good 98.1% |
| Filipinos | 78.3 /100 | #146 | Good 98.0% |
| Immigrants | Israel | 77.6 /100 | #147 | Good 98.0% |
| Apache | 75.0 /100 | #148 | Good 98.0% |
| Immigrants | Greece | 74.9 /100 | #149 | Good 98.0% |
| Jordanians | 72.8 /100 | #150 | Good 98.0% |
| Soviet Union | 70.8 /100 | #151 | Good 98.0% |
| Dutch West Indians | 70.1 /100 | #152 | Good 98.0% |
Demographics Similar to Tlingit-Haida by Kindergarten
In terms of kindergarten, the demographic groups most similar to Tlingit-Haida are Slovak (98.7%, a difference of 0.0%), Norwegian (98.7%, a difference of 0.010%), German (98.7%, a difference of 0.010%), Slovene (98.7%, a difference of 0.030%), and Alaska Native (98.7%, a difference of 0.040%).
| Demographics | Rating | Rank | Kindergarten |
| Yup'ik | 100.0 /100 | #2 | Exceptional 99.2% |
| Inupiat | 100.0 /100 | #3 | Exceptional 98.9% |
| Welsh | 100.0 /100 | #4 | Exceptional 98.9% |
| Tsimshian | 100.0 /100 | #5 | Exceptional 98.8% |
| Alaskan Athabascans | 100.0 /100 | #6 | Exceptional 98.8% |
| Alaska Natives | 100.0 /100 | #7 | Exceptional 98.7% |
| Norwegians | 100.0 /100 | #8 | Exceptional 98.7% |
| Tlingit-Haida | 100.0 /100 | #9 | Exceptional 98.7% |
| Slovaks | 100.0 /100 | #10 | Exceptional 98.7% |
| Germans | 100.0 /100 | #11 | Exceptional 98.7% |
| Slovenes | 100.0 /100 | #12 | Exceptional 98.7% |
| Carpatho Rusyns | 100.0 /100 | #13 | Exceptional 98.7% |
| English | 100.0 /100 | #14 | Exceptional 98.7% |
| Swedes | 100.0 /100 | #15 | Exceptional 98.7% |
| Aleuts | 100.0 /100 | #16 | Exceptional 98.6% |