Hmong vs Immigrants from Belgium 8th Grade
COMPARE
Hmong
Immigrants from Belgium
8th Grade
8th Grade Comparison
Hmong
Immigrants from Belgium
96.1%
8TH GRADE
89.7/ 100
METRIC RATING
139th/ 347
METRIC RANK
96.5%
8TH GRADE
99.1/ 100
METRIC RATING
84th/ 347
METRIC RANK
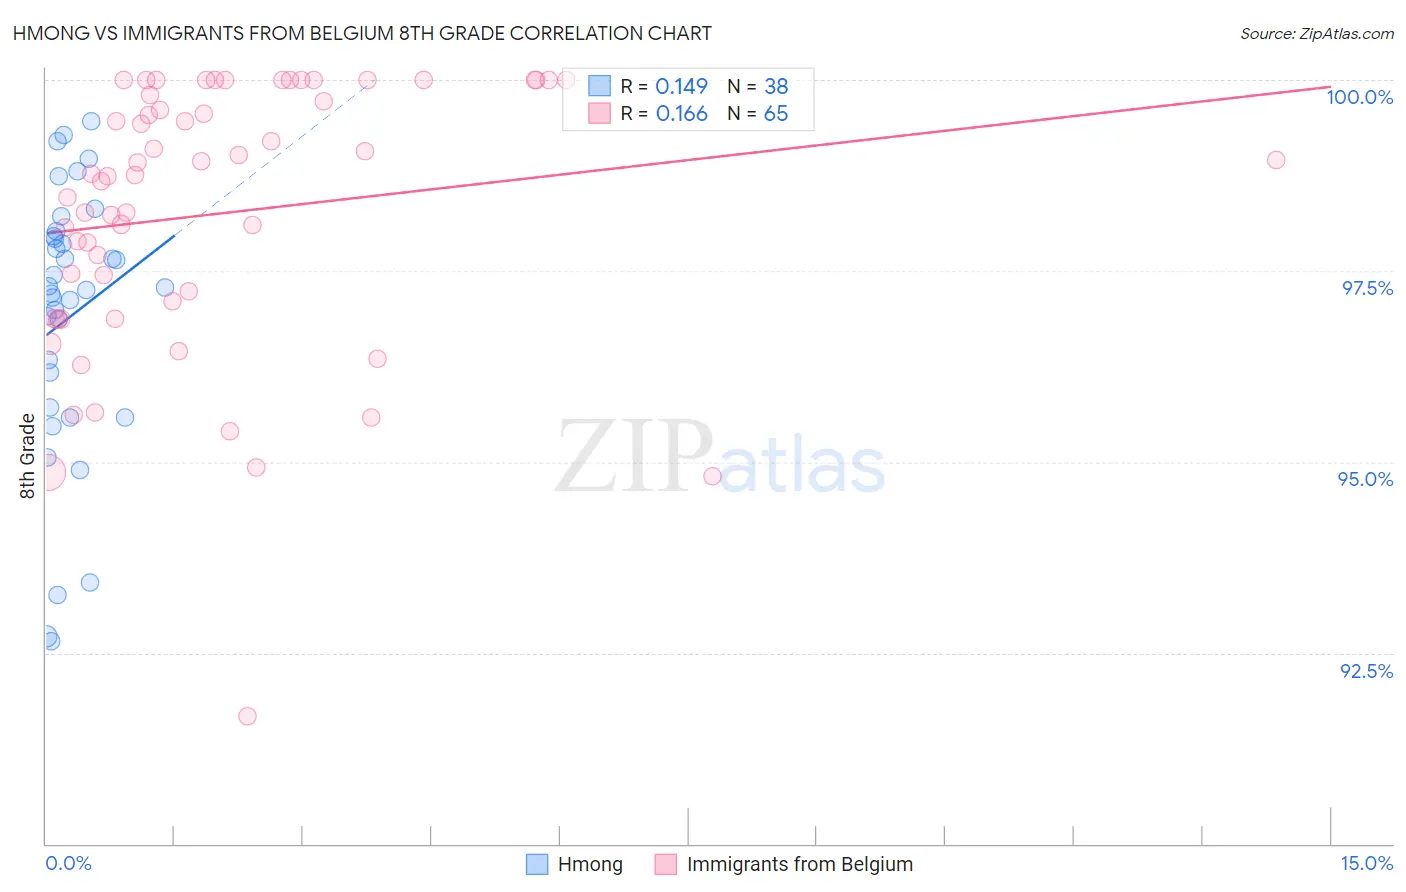
Hmong vs Immigrants from Belgium 8th Grade Correlation Chart
The statistical analysis conducted on geographies consisting of 24,672,093 people shows a poor positive correlation between the proportion of Hmong and percentage of population with at least 8th grade education in the United States with a correlation coefficient (R) of 0.149 and weighted average of 96.1%. Similarly, the statistical analysis conducted on geographies consisting of 146,727,969 people shows a poor positive correlation between the proportion of Immigrants from Belgium and percentage of population with at least 8th grade education in the United States with a correlation coefficient (R) of 0.166 and weighted average of 96.5%, a difference of 0.41%.
8th Grade Correlation Summary
| Measurement | Hmong | Immigrants from Belgium |
| Minimum | 92.7% | 91.7% |
| Maximum | 99.5% | 100.0% |
| Range | 6.8% | 8.3% |
| Mean | 96.9% | 98.3% |
| Median | 97.3% | 98.8% |
| Interquartile 25% (IQ1) | 95.7% | 97.0% |
| Interquartile 75% (IQ3) | 98.0% | 99.9% |
| Interquartile Range (IQR) | 2.2% | 2.9% |
| Standard Deviation (Sample) | 1.8% | 1.8% |
| Standard Deviation (Population) | 1.8% | 1.8% |
Similar Demographics by 8th Grade
Demographics Similar to Hmong by 8th Grade
In terms of 8th grade, the demographic groups most similar to Hmong are Burmese (96.1%, a difference of 0.010%), Immigrants from South Central Asia (96.1%, a difference of 0.010%), Cambodian (96.1%, a difference of 0.020%), Immigrants from Hungary (96.1%, a difference of 0.030%), and Basque (96.1%, a difference of 0.030%).
| Demographics | Rating | Rank | 8th Grade |
| Immigrants | Kuwait | 92.2 /100 | #132 | Exceptional 96.1% |
| Immigrants | Turkey | 91.7 /100 | #133 | Exceptional 96.1% |
| Immigrants | Hungary | 91.5 /100 | #134 | Exceptional 96.1% |
| Basques | 91.5 /100 | #135 | Exceptional 96.1% |
| Jordanians | 91.3 /100 | #136 | Exceptional 96.1% |
| Cambodians | 90.6 /100 | #137 | Exceptional 96.1% |
| Burmese | 90.2 /100 | #138 | Exceptional 96.1% |
| Hmong | 89.7 /100 | #139 | Excellent 96.1% |
| Immigrants | South Central Asia | 89.4 /100 | #140 | Excellent 96.1% |
| Immigrants | Greece | 85.9 /100 | #141 | Excellent 96.0% |
| Immigrants | Eastern Europe | 85.4 /100 | #142 | Excellent 96.0% |
| Spanish | 85.1 /100 | #143 | Excellent 96.0% |
| Immigrants | Belarus | 84.8 /100 | #144 | Excellent 96.0% |
| Lumbee | 84.1 /100 | #145 | Excellent 96.0% |
| Israelis | 84.1 /100 | #146 | Excellent 96.0% |
Demographics Similar to Immigrants from Belgium by 8th Grade
In terms of 8th grade, the demographic groups most similar to Immigrants from Belgium are Icelander (96.5%, a difference of 0.010%), Immigrants from South Africa (96.5%, a difference of 0.010%), Cherokee (96.5%, a difference of 0.010%), Delaware (96.5%, a difference of 0.020%), and Romanian (96.5%, a difference of 0.020%).
| Demographics | Rating | Rank | 8th Grade |
| Cypriots | 99.4 /100 | #77 | Exceptional 96.5% |
| Yugoslavians | 99.4 /100 | #78 | Exceptional 96.5% |
| Puget Sound Salish | 99.3 /100 | #79 | Exceptional 96.5% |
| Delaware | 99.2 /100 | #80 | Exceptional 96.5% |
| Romanians | 99.2 /100 | #81 | Exceptional 96.5% |
| Turks | 99.2 /100 | #82 | Exceptional 96.5% |
| Icelanders | 99.2 /100 | #83 | Exceptional 96.5% |
| Immigrants | Belgium | 99.1 /100 | #84 | Exceptional 96.5% |
| Immigrants | South Africa | 99.1 /100 | #85 | Exceptional 96.5% |
| Cherokee | 99.0 /100 | #86 | Exceptional 96.5% |
| Immigrants | Australia | 99.0 /100 | #87 | Exceptional 96.5% |
| Immigrants | Western Europe | 99.0 /100 | #88 | Exceptional 96.4% |
| Chickasaw | 98.9 /100 | #89 | Exceptional 96.4% |
| Immigrants | Sweden | 98.9 /100 | #90 | Exceptional 96.4% |
| Thais | 98.9 /100 | #91 | Exceptional 96.4% |