Hmong vs Immigrants from Ukraine 6th Grade
COMPARE
Hmong
Immigrants from Ukraine
6th Grade
6th Grade Comparison
Hmong
Immigrants from Ukraine
97.4%
6TH GRADE
94.4/ 100
METRIC RATING
123rd/ 347
METRIC RANK
97.0%
6TH GRADE
35.6/ 100
METRIC RATING
182nd/ 347
METRIC RANK
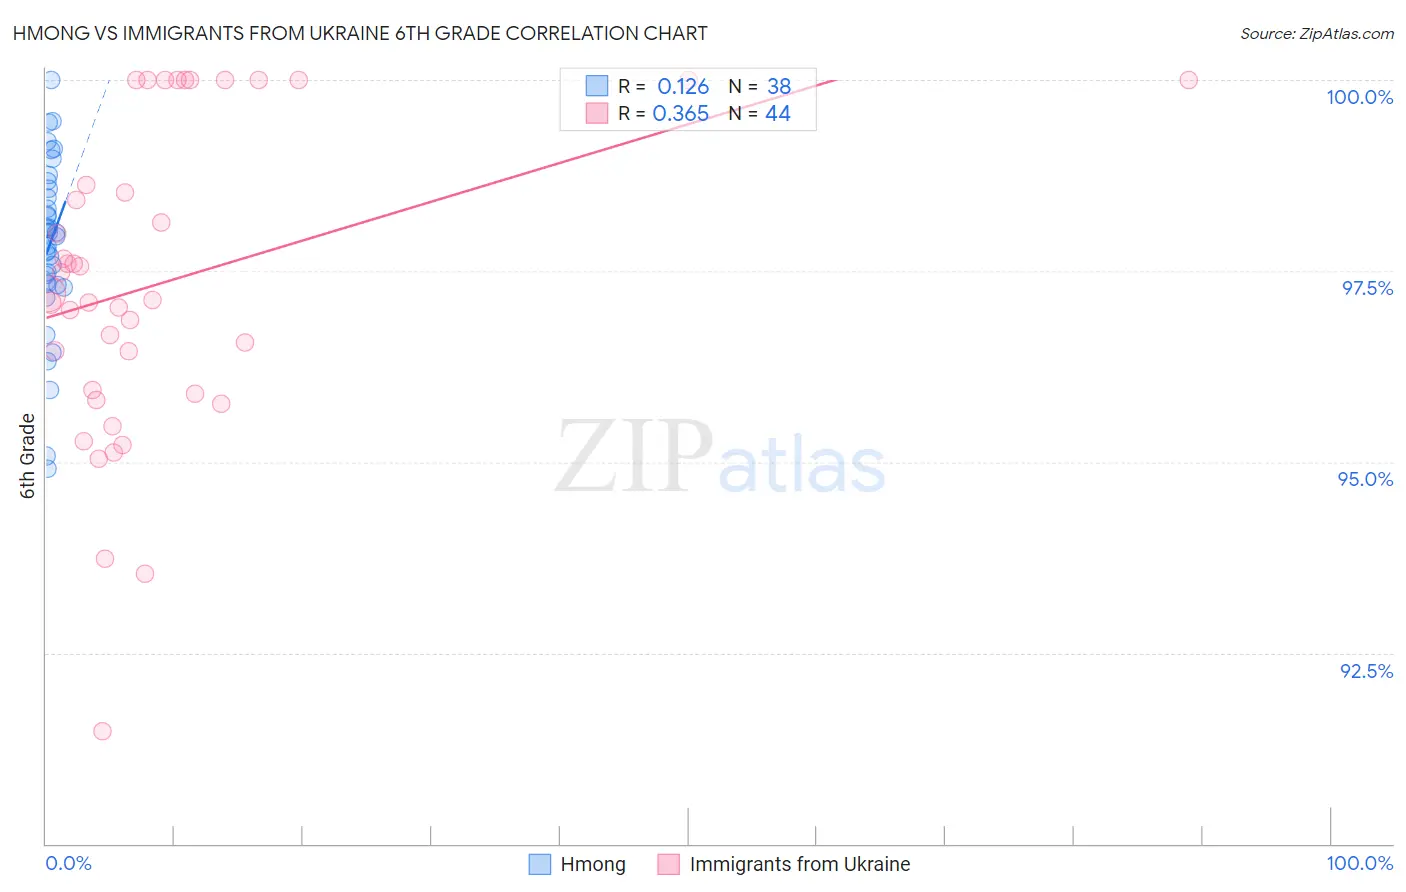
Hmong vs Immigrants from Ukraine 6th Grade Correlation Chart
The statistical analysis conducted on geographies consisting of 24,672,093 people shows a poor positive correlation between the proportion of Hmong and percentage of population with at least 6th grade education in the United States with a correlation coefficient (R) of 0.126 and weighted average of 97.4%. Similarly, the statistical analysis conducted on geographies consisting of 289,712,791 people shows a mild positive correlation between the proportion of Immigrants from Ukraine and percentage of population with at least 6th grade education in the United States with a correlation coefficient (R) of 0.365 and weighted average of 97.0%, a difference of 0.39%.
6th Grade Correlation Summary
| Measurement | Hmong | Immigrants from Ukraine |
| Minimum | 94.9% | 91.5% |
| Maximum | 100.0% | 100.0% |
| Range | 5.1% | 8.5% |
| Mean | 97.8% | 97.3% |
| Median | 98.0% | 97.2% |
| Interquartile 25% (IQ1) | 97.3% | 95.9% |
| Interquartile 75% (IQ3) | 98.6% | 99.3% |
| Interquartile Range (IQR) | 1.2% | 3.4% |
| Standard Deviation (Sample) | 1.1% | 2.0% |
| Standard Deviation (Population) | 1.1% | 2.0% |
Similar Demographics by 6th Grade
Demographics Similar to Hmong by 6th Grade
In terms of 6th grade, the demographic groups most similar to Hmong are Immigrants from France (97.4%, a difference of 0.0%), Okinawan (97.4%, a difference of 0.0%), Immigrants from Zimbabwe (97.4%, a difference of 0.010%), Syrian (97.4%, a difference of 0.010%), and Immigrants from Norway (97.4%, a difference of 0.010%).
| Demographics | Rating | Rank | 6th Grade |
| Lebanese | 95.5 /100 | #116 | Exceptional 97.4% |
| Basques | 95.4 /100 | #117 | Exceptional 97.4% |
| Immigrants | Japan | 95.2 /100 | #118 | Exceptional 97.4% |
| Immigrants | Zimbabwe | 95.0 /100 | #119 | Exceptional 97.4% |
| Syrians | 94.8 /100 | #120 | Exceptional 97.4% |
| Immigrants | Norway | 94.7 /100 | #121 | Exceptional 97.4% |
| Immigrants | France | 94.5 /100 | #122 | Exceptional 97.4% |
| Hmong | 94.4 /100 | #123 | Exceptional 97.4% |
| Okinawans | 94.2 /100 | #124 | Exceptional 97.4% |
| Spanish | 93.7 /100 | #125 | Exceptional 97.3% |
| Immigrants | Bulgaria | 93.6 /100 | #126 | Exceptional 97.3% |
| Immigrants | Croatia | 93.1 /100 | #127 | Exceptional 97.3% |
| Immigrants | Romania | 92.0 /100 | #128 | Exceptional 97.3% |
| Immigrants | Serbia | 91.9 /100 | #129 | Exceptional 97.3% |
| Cambodians | 91.8 /100 | #130 | Exceptional 97.3% |
Demographics Similar to Immigrants from Ukraine by 6th Grade
In terms of 6th grade, the demographic groups most similar to Immigrants from Ukraine are Comanche (97.0%, a difference of 0.010%), Immigrants from Venezuela (97.0%, a difference of 0.010%), Spanish American (97.0%, a difference of 0.010%), Argentinean (97.0%, a difference of 0.010%), and Immigrants from Spain (97.0%, a difference of 0.020%).
| Demographics | Rating | Rank | 6th Grade |
| Immigrants | Kazakhstan | 47.3 /100 | #175 | Average 97.0% |
| Immigrants | Micronesia | 47.1 /100 | #176 | Average 97.0% |
| Mongolians | 46.7 /100 | #177 | Average 97.0% |
| Pakistanis | 46.0 /100 | #178 | Average 97.0% |
| Immigrants | Kenya | 45.3 /100 | #179 | Average 97.0% |
| Immigrants | Spain | 39.9 /100 | #180 | Fair 97.0% |
| Comanche | 37.9 /100 | #181 | Fair 97.0% |
| Immigrants | Ukraine | 35.6 /100 | #182 | Fair 97.0% |
| Immigrants | Venezuela | 34.5 /100 | #183 | Fair 97.0% |
| Spanish Americans | 33.5 /100 | #184 | Fair 97.0% |
| Argentineans | 33.0 /100 | #185 | Fair 97.0% |
| Immigrants | Egypt | 31.4 /100 | #186 | Fair 97.0% |
| Guamanians/Chamorros | 30.6 /100 | #187 | Fair 97.0% |
| Immigrants | Argentina | 30.4 /100 | #188 | Fair 97.0% |
| Blacks/African Americans | 30.2 /100 | #189 | Fair 97.0% |