Immigrants from Singapore vs Immigrants from Belgium 8th Grade
COMPARE
Immigrants from Singapore
Immigrants from Belgium
8th Grade
8th Grade Comparison
Immigrants from Singapore
Immigrants from Belgium
96.4%
8TH GRADE
98.8/ 100
METRIC RATING
94th/ 347
METRIC RANK
96.5%
8TH GRADE
99.1/ 100
METRIC RATING
84th/ 347
METRIC RANK
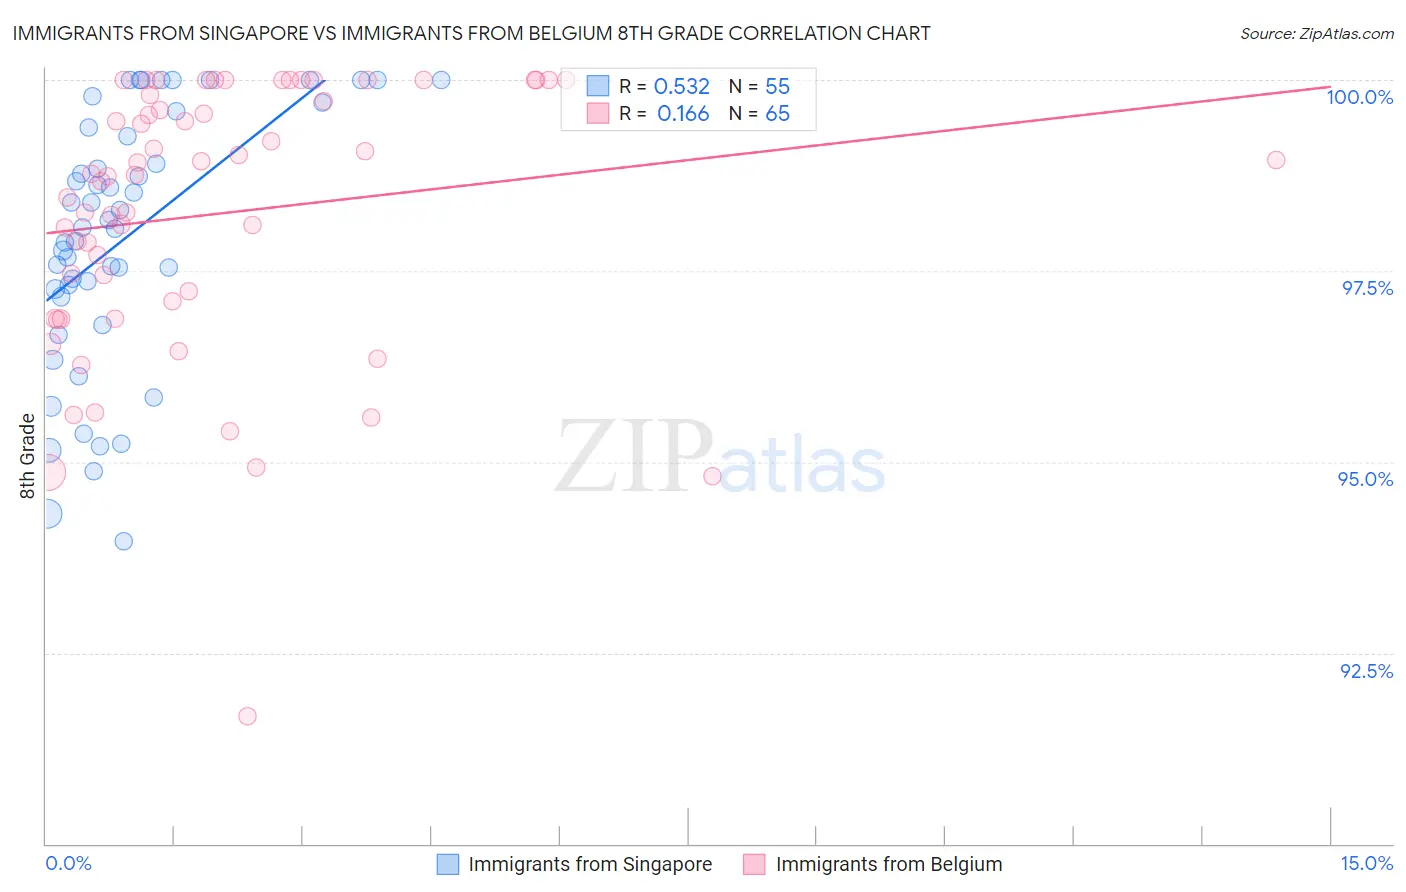
Immigrants from Singapore vs Immigrants from Belgium 8th Grade Correlation Chart
The statistical analysis conducted on geographies consisting of 137,519,875 people shows a substantial positive correlation between the proportion of Immigrants from Singapore and percentage of population with at least 8th grade education in the United States with a correlation coefficient (R) of 0.532 and weighted average of 96.4%. Similarly, the statistical analysis conducted on geographies consisting of 146,727,969 people shows a poor positive correlation between the proportion of Immigrants from Belgium and percentage of population with at least 8th grade education in the United States with a correlation coefficient (R) of 0.166 and weighted average of 96.5%, a difference of 0.060%.
8th Grade Correlation Summary
| Measurement | Immigrants from Singapore | Immigrants from Belgium |
| Minimum | 94.0% | 91.7% |
| Maximum | 100.0% | 100.0% |
| Range | 6.0% | 8.3% |
| Mean | 97.9% | 98.3% |
| Median | 98.1% | 98.8% |
| Interquartile 25% (IQ1) | 97.2% | 97.0% |
| Interquartile 75% (IQ3) | 99.4% | 99.9% |
| Interquartile Range (IQR) | 2.2% | 2.9% |
| Standard Deviation (Sample) | 1.7% | 1.8% |
| Standard Deviation (Population) | 1.6% | 1.8% |
Demographics Similar to Immigrants from Singapore and Immigrants from Belgium by 8th Grade
In terms of 8th grade, the demographic groups most similar to Immigrants from Singapore are German Russian (96.4%, a difference of 0.0%), Immigrants from Sweden (96.4%, a difference of 0.010%), Thai (96.4%, a difference of 0.010%), Menominee (96.4%, a difference of 0.010%), and Immigrants from Denmark (96.4%, a difference of 0.010%). Similarly, the demographic groups most similar to Immigrants from Belgium are Icelander (96.5%, a difference of 0.010%), Immigrants from South Africa (96.5%, a difference of 0.010%), Cherokee (96.5%, a difference of 0.010%), Delaware (96.5%, a difference of 0.020%), and Romanian (96.5%, a difference of 0.020%).
| Demographics | Rating | Rank | 8th Grade |
| Puget Sound Salish | 99.3 /100 | #79 | Exceptional 96.5% |
| Delaware | 99.2 /100 | #80 | Exceptional 96.5% |
| Romanians | 99.2 /100 | #81 | Exceptional 96.5% |
| Turks | 99.2 /100 | #82 | Exceptional 96.5% |
| Icelanders | 99.2 /100 | #83 | Exceptional 96.5% |
| Immigrants | Belgium | 99.1 /100 | #84 | Exceptional 96.5% |
| Immigrants | South Africa | 99.1 /100 | #85 | Exceptional 96.5% |
| Cherokee | 99.0 /100 | #86 | Exceptional 96.5% |
| Immigrants | Australia | 99.0 /100 | #87 | Exceptional 96.5% |
| Immigrants | Western Europe | 99.0 /100 | #88 | Exceptional 96.4% |
| Chickasaw | 98.9 /100 | #89 | Exceptional 96.4% |
| Immigrants | Sweden | 98.9 /100 | #90 | Exceptional 96.4% |
| Thais | 98.9 /100 | #91 | Exceptional 96.4% |
| Menominee | 98.9 /100 | #92 | Exceptional 96.4% |
| Immigrants | Denmark | 98.8 /100 | #93 | Exceptional 96.4% |
| Immigrants | Singapore | 98.8 /100 | #94 | Exceptional 96.4% |
| German Russians | 98.8 /100 | #95 | Exceptional 96.4% |
| Potawatomi | 98.7 /100 | #96 | Exceptional 96.4% |
| Osage | 98.7 /100 | #97 | Exceptional 96.4% |
| Immigrants | Germany | 98.7 /100 | #98 | Exceptional 96.4% |
| Cree | 98.6 /100 | #99 | Exceptional 96.4% |