Immigrants from Saudi Arabia vs Lithuanian No Schooling Completed
COMPARE
Immigrants from Saudi Arabia
Lithuanian
No Schooling Completed
No Schooling Completed Comparison
Immigrants from Saudi Arabia
Lithuanians
1.9%
NO SCHOOLING COMPLETED
96.8/ 100
METRIC RATING
109th/ 347
METRIC RANK
1.4%
NO SCHOOLING COMPLETED
100.0/ 100
METRIC RATING
11th/ 347
METRIC RANK
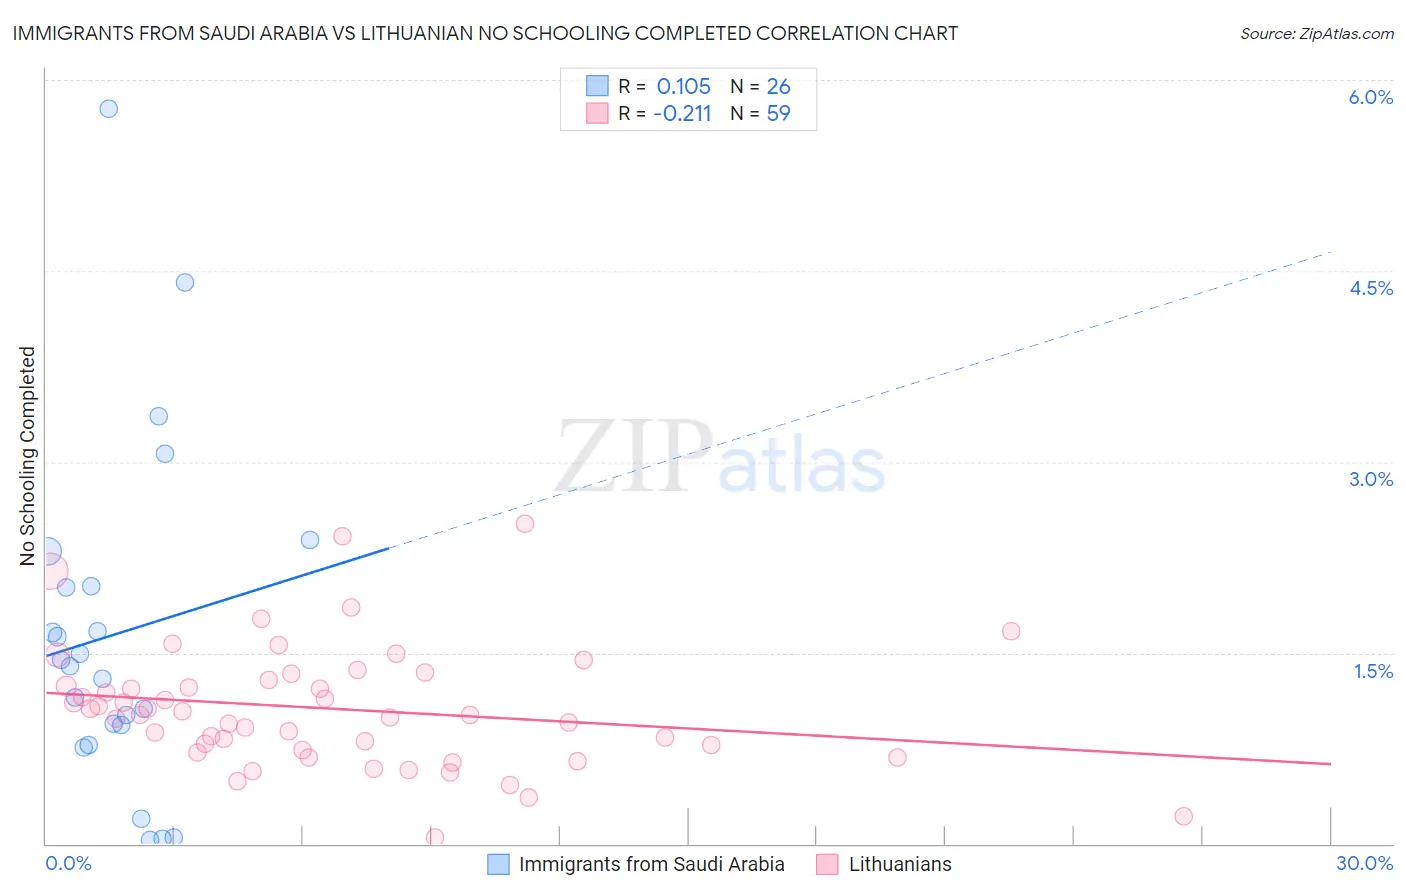
Immigrants from Saudi Arabia vs Lithuanian No Schooling Completed Correlation Chart
The statistical analysis conducted on geographies consisting of 163,882,762 people shows a poor positive correlation between the proportion of Immigrants from Saudi Arabia and percentage of population with no schooling in the United States with a correlation coefficient (R) of 0.105 and weighted average of 1.9%. Similarly, the statistical analysis conducted on geographies consisting of 415,193,435 people shows a weak negative correlation between the proportion of Lithuanians and percentage of population with no schooling in the United States with a correlation coefficient (R) of -0.211 and weighted average of 1.4%, a difference of 28.9%.
No Schooling Completed Correlation Summary
| Measurement | Immigrants from Saudi Arabia | Lithuanian |
| Minimum | 0.031% | 0.047% |
| Maximum | 5.8% | 2.5% |
| Range | 5.7% | 2.5% |
| Mean | 1.6% | 1.1% |
| Median | 1.4% | 1.0% |
| Interquartile 25% (IQ1) | 0.93% | 0.74% |
| Interquartile 75% (IQ3) | 2.0% | 1.3% |
| Interquartile Range (IQR) | 1.1% | 0.55% |
| Standard Deviation (Sample) | 1.3% | 0.48% |
| Standard Deviation (Population) | 1.3% | 0.47% |
Similar Demographics by No Schooling Completed
Demographics Similar to Immigrants from Saudi Arabia by No Schooling Completed
In terms of no schooling completed, the demographic groups most similar to Immigrants from Saudi Arabia are Immigrants from Latvia (1.9%, a difference of 0.13%), Immigrants from Japan (1.9%, a difference of 0.28%), Okinawan (1.8%, a difference of 0.35%), Pueblo (1.9%, a difference of 0.47%), and Yugoslavian (1.8%, a difference of 0.57%).
| Demographics | Rating | Rank | No Schooling Completed |
| Immigrants | Switzerland | 97.9 /100 | #102 | Exceptional 1.8% |
| Basques | 97.9 /100 | #103 | Exceptional 1.8% |
| Thais | 97.5 /100 | #104 | Exceptional 1.8% |
| German Russians | 97.5 /100 | #105 | Exceptional 1.8% |
| Immigrants | France | 97.3 /100 | #106 | Exceptional 1.8% |
| Yugoslavians | 97.2 /100 | #107 | Exceptional 1.8% |
| Okinawans | 97.1 /100 | #108 | Exceptional 1.8% |
| Immigrants | Saudi Arabia | 96.8 /100 | #109 | Exceptional 1.9% |
| Immigrants | Latvia | 96.7 /100 | #110 | Exceptional 1.9% |
| Immigrants | Japan | 96.6 /100 | #111 | Exceptional 1.9% |
| Pueblo | 96.4 /100 | #112 | Exceptional 1.9% |
| Immigrants | Zimbabwe | 96.2 /100 | #113 | Exceptional 1.9% |
| Immigrants | Norway | 96.1 /100 | #114 | Exceptional 1.9% |
| Syrians | 96.0 /100 | #115 | Exceptional 1.9% |
| Lebanese | 96.0 /100 | #116 | Exceptional 1.9% |
Demographics Similar to Lithuanians by No Schooling Completed
In terms of no schooling completed, the demographic groups most similar to Lithuanians are Irish (1.4%, a difference of 0.030%), Polish (1.4%, a difference of 0.050%), Dutch (1.4%, a difference of 0.84%), Scotch-Irish (1.5%, a difference of 1.0%), and Tlingit-Haida (1.5%, a difference of 1.1%).
| Demographics | Rating | Rank | No Schooling Completed |
| Germans | 100.0 /100 | #4 | Exceptional 1.4% |
| Slovenes | 100.0 /100 | #5 | Exceptional 1.4% |
| Carpatho Rusyns | 100.0 /100 | #6 | Exceptional 1.4% |
| English | 100.0 /100 | #7 | Exceptional 1.4% |
| Swedes | 100.0 /100 | #8 | Exceptional 1.4% |
| Scottish | 100.0 /100 | #9 | Exceptional 1.4% |
| Dutch | 100.0 /100 | #10 | Exceptional 1.4% |
| Lithuanians | 100.0 /100 | #11 | Exceptional 1.4% |
| Irish | 100.0 /100 | #12 | Exceptional 1.4% |
| Poles | 100.0 /100 | #13 | Exceptional 1.4% |
| Scotch-Irish | 100.0 /100 | #14 | Exceptional 1.5% |
| Tlingit-Haida | 100.0 /100 | #15 | Exceptional 1.5% |
| Finns | 100.0 /100 | #16 | Exceptional 1.5% |
| Croatians | 100.0 /100 | #17 | Exceptional 1.5% |
| Danes | 100.0 /100 | #18 | Exceptional 1.5% |