Guyanese vs Egyptian 5th Grade
COMPARE
Guyanese
Egyptian
5th Grade
5th Grade Comparison
Guyanese
Egyptians
96.1%
5TH GRADE
0.0/ 100
METRIC RATING
302nd/ 347
METRIC RANK
97.3%
5TH GRADE
52.4/ 100
METRIC RATING
173rd/ 347
METRIC RANK
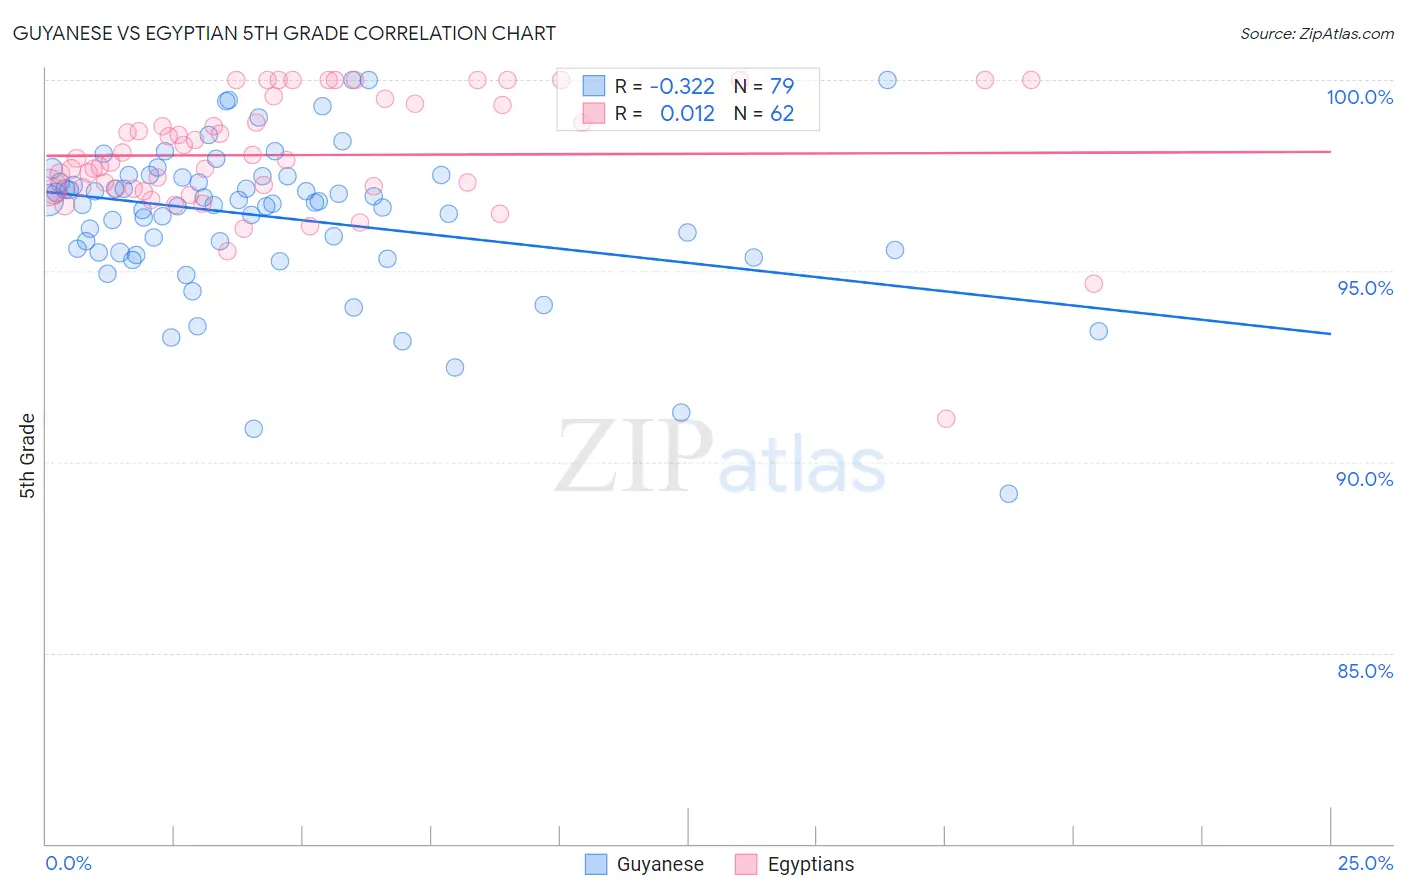
Guyanese vs Egyptian 5th Grade Correlation Chart
The statistical analysis conducted on geographies consisting of 176,921,765 people shows a mild negative correlation between the proportion of Guyanese and percentage of population with at least 5th grade education in the United States with a correlation coefficient (R) of -0.322 and weighted average of 96.1%. Similarly, the statistical analysis conducted on geographies consisting of 276,927,423 people shows no correlation between the proportion of Egyptians and percentage of population with at least 5th grade education in the United States with a correlation coefficient (R) of 0.012 and weighted average of 97.3%, a difference of 1.3%.
5th Grade Correlation Summary
| Measurement | Guyanese | Egyptian |
| Minimum | 89.2% | 91.1% |
| Maximum | 100.0% | 100.0% |
| Range | 10.8% | 8.9% |
| Mean | 96.4% | 98.0% |
| Median | 96.8% | 97.9% |
| Interquartile 25% (IQ1) | 95.5% | 97.2% |
| Interquartile 75% (IQ3) | 97.5% | 99.4% |
| Interquartile Range (IQR) | 2.0% | 2.2% |
| Standard Deviation (Sample) | 2.0% | 1.6% |
| Standard Deviation (Population) | 2.0% | 1.6% |
Similar Demographics by 5th Grade
Demographics Similar to Guyanese by 5th Grade
In terms of 5th grade, the demographic groups most similar to Guyanese are Immigrants from Cuba (96.1%, a difference of 0.010%), Puerto Rican (96.1%, a difference of 0.010%), Sri Lankan (96.1%, a difference of 0.030%), Immigrants from Burma/Myanmar (96.1%, a difference of 0.040%), and Immigrants from Laos (96.0%, a difference of 0.050%).
| Demographics | Rating | Rank | 5th Grade |
| Immigrants | Somalia | 0.0 /100 | #295 | Tragic 96.4% |
| Immigrants | South Eastern Asia | 0.0 /100 | #296 | Tragic 96.3% |
| Haitians | 0.0 /100 | #297 | Tragic 96.3% |
| Immigrants | Dominica | 0.0 /100 | #298 | Tragic 96.2% |
| Immigrants | Immigrants | 0.0 /100 | #299 | Tragic 96.2% |
| Sri Lankans | 0.0 /100 | #300 | Tragic 96.1% |
| Immigrants | Cuba | 0.0 /100 | #301 | Tragic 96.1% |
| Guyanese | 0.0 /100 | #302 | Tragic 96.1% |
| Puerto Ricans | 0.0 /100 | #303 | Tragic 96.1% |
| Immigrants | Burma/Myanmar | 0.0 /100 | #304 | Tragic 96.1% |
| Immigrants | Laos | 0.0 /100 | #305 | Tragic 96.0% |
| Immigrants | Haiti | 0.0 /100 | #306 | Tragic 96.0% |
| Immigrants | Caribbean | 0.0 /100 | #307 | Tragic 96.0% |
| Ecuadorians | 0.0 /100 | #308 | Tragic 96.0% |
| Immigrants | Guyana | 0.0 /100 | #309 | Tragic 96.0% |
Demographics Similar to Egyptians by 5th Grade
In terms of 5th grade, the demographic groups most similar to Egyptians are Arab (97.3%, a difference of 0.0%), Immigrants from Belarus (97.3%, a difference of 0.010%), Chilean (97.3%, a difference of 0.010%), Immigrants from Korea (97.3%, a difference of 0.010%), and Venezuelan (97.3%, a difference of 0.010%).
| Demographics | Rating | Rank | 5th Grade |
| Apache | 57.2 /100 | #166 | Average 97.4% |
| Immigrants | Belarus | 54.6 /100 | #167 | Average 97.3% |
| Chileans | 54.5 /100 | #168 | Average 97.3% |
| Immigrants | Korea | 54.1 /100 | #169 | Average 97.3% |
| Venezuelans | 54.0 /100 | #170 | Average 97.3% |
| Immigrants | Sri Lanka | 53.8 /100 | #171 | Average 97.3% |
| Arabs | 53.4 /100 | #172 | Average 97.3% |
| Egyptians | 52.4 /100 | #173 | Average 97.3% |
| Immigrants | Kazakhstan | 50.0 /100 | #174 | Average 97.3% |
| Immigrants | Micronesia | 48.8 /100 | #175 | Average 97.3% |
| Immigrants | Taiwan | 48.4 /100 | #176 | Average 97.3% |
| Immigrants | Spain | 47.0 /100 | #177 | Average 97.3% |
| Comanche | 42.1 /100 | #178 | Average 97.3% |
| Immigrants | Kenya | 40.3 /100 | #179 | Average 97.3% |
| Pakistanis | 40.2 /100 | #180 | Average 97.3% |