Ghanaian vs Cherokee 10th Grade
COMPARE
Ghanaian
Cherokee
10th Grade
10th Grade Comparison
Ghanaians
Cherokee
92.8%
10TH GRADE
0.9/ 100
METRIC RATING
253rd/ 347
METRIC RANK
94.1%
10TH GRADE
84.9/ 100
METRIC RATING
143rd/ 347
METRIC RANK
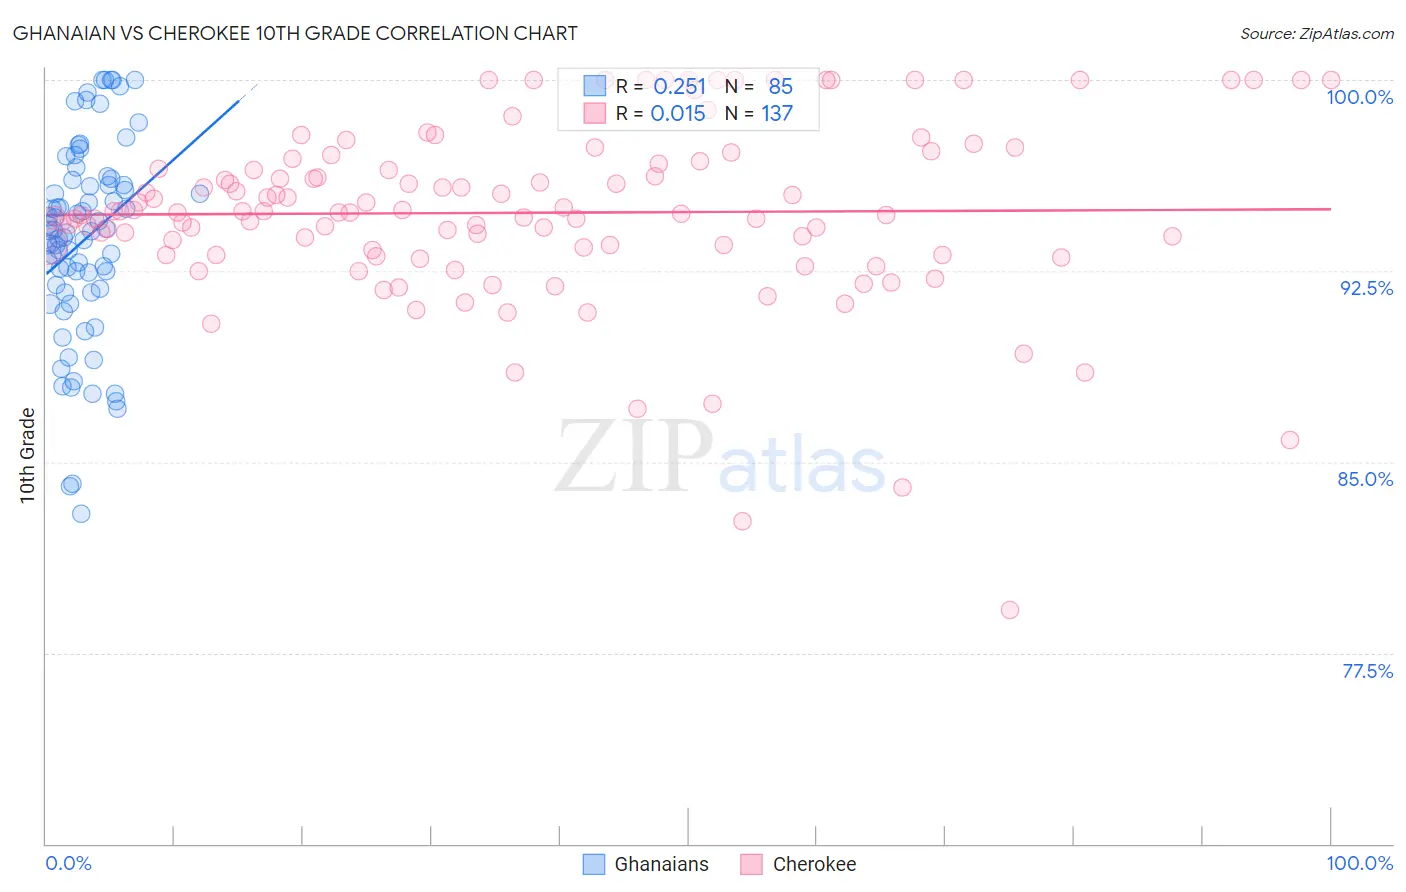
Ghanaian vs Cherokee 10th Grade Correlation Chart
The statistical analysis conducted on geographies consisting of 190,714,671 people shows a weak positive correlation between the proportion of Ghanaians and percentage of population with at least 10th grade education in the United States with a correlation coefficient (R) of 0.251 and weighted average of 92.8%. Similarly, the statistical analysis conducted on geographies consisting of 493,720,058 people shows no correlation between the proportion of Cherokee and percentage of population with at least 10th grade education in the United States with a correlation coefficient (R) of 0.015 and weighted average of 94.1%, a difference of 1.5%.
10th Grade Correlation Summary
| Measurement | Ghanaian | Cherokee |
| Minimum | 83.0% | 79.2% |
| Maximum | 100.0% | 100.0% |
| Range | 17.0% | 20.8% |
| Mean | 93.7% | 94.8% |
| Median | 94.1% | 94.8% |
| Interquartile 25% (IQ1) | 91.7% | 93.2% |
| Interquartile 75% (IQ3) | 96.0% | 96.8% |
| Interquartile Range (IQR) | 4.3% | 3.6% |
| Standard Deviation (Sample) | 3.8% | 3.5% |
| Standard Deviation (Population) | 3.8% | 3.5% |
Similar Demographics by 10th Grade
Demographics Similar to Ghanaians by 10th Grade
In terms of 10th grade, the demographic groups most similar to Ghanaians are South American (92.8%, a difference of 0.0%), Immigrants from Thailand (92.8%, a difference of 0.010%), Armenian (92.7%, a difference of 0.010%), Jamaican (92.8%, a difference of 0.060%), and Immigrants from Bolivia (92.7%, a difference of 0.060%).
| Demographics | Rating | Rank | 10th Grade |
| Immigrants | Middle Africa | 1.7 /100 | #246 | Tragic 92.9% |
| Immigrants | Afghanistan | 1.4 /100 | #247 | Tragic 92.8% |
| Colombians | 1.4 /100 | #248 | Tragic 92.8% |
| Immigrants | Senegal | 1.4 /100 | #249 | Tragic 92.8% |
| Jamaicans | 1.2 /100 | #250 | Tragic 92.8% |
| Immigrants | Thailand | 1.0 /100 | #251 | Tragic 92.8% |
| South Americans | 0.9 /100 | #252 | Tragic 92.8% |
| Ghanaians | 0.9 /100 | #253 | Tragic 92.8% |
| Armenians | 0.9 /100 | #254 | Tragic 92.7% |
| Immigrants | Bolivia | 0.7 /100 | #255 | Tragic 92.7% |
| Immigrants | Nigeria | 0.7 /100 | #256 | Tragic 92.7% |
| U.S. Virgin Islanders | 0.7 /100 | #257 | Tragic 92.7% |
| Immigrants | Costa Rica | 0.6 /100 | #258 | Tragic 92.7% |
| Immigrants | Jamaica | 0.5 /100 | #259 | Tragic 92.6% |
| Immigrants | Uzbekistan | 0.5 /100 | #260 | Tragic 92.6% |
Demographics Similar to Cherokee by 10th Grade
In terms of 10th grade, the demographic groups most similar to Cherokee are Immigrants from Kazakhstan (94.1%, a difference of 0.0%), Nonimmigrants (94.1%, a difference of 0.020%), Hmong (94.1%, a difference of 0.030%), Albanian (94.1%, a difference of 0.030%), and Chickasaw (94.1%, a difference of 0.040%).
| Demographics | Rating | Rank | 10th Grade |
| Shoshone | 90.8 /100 | #136 | Exceptional 94.2% |
| Arapaho | 90.5 /100 | #137 | Exceptional 94.2% |
| Immigrants | Sri Lanka | 89.9 /100 | #138 | Excellent 94.2% |
| Immigrants | Bosnia and Herzegovina | 89.4 /100 | #139 | Excellent 94.2% |
| Immigrants | Jordan | 87.6 /100 | #140 | Excellent 94.1% |
| Hmong | 86.6 /100 | #141 | Excellent 94.1% |
| Albanians | 86.5 /100 | #142 | Excellent 94.1% |
| Cherokee | 84.9 /100 | #143 | Excellent 94.1% |
| Immigrants | Kazakhstan | 84.9 /100 | #144 | Excellent 94.1% |
| Immigrants | Nonimmigrants | 83.8 /100 | #145 | Excellent 94.1% |
| Chickasaw | 82.6 /100 | #146 | Excellent 94.1% |
| Immigrants | Ukraine | 81.5 /100 | #147 | Excellent 94.0% |
| Arabs | 80.9 /100 | #148 | Excellent 94.0% |
| Ugandans | 80.7 /100 | #149 | Excellent 94.0% |
| Egyptians | 79.6 /100 | #150 | Good 94.0% |