Immigrants from Lebanon vs Vietnamese Doctorate Degree
COMPARE
Immigrants from Lebanon
Vietnamese
Doctorate Degree
Doctorate Degree Comparison
Immigrants from Lebanon
Vietnamese
2.2%
DOCTORATE DEGREE
99.8/ 100
METRIC RATING
77th/ 347
METRIC RANK
1.9%
DOCTORATE DEGREE
54.8/ 100
METRIC RATING
169th/ 347
METRIC RANK
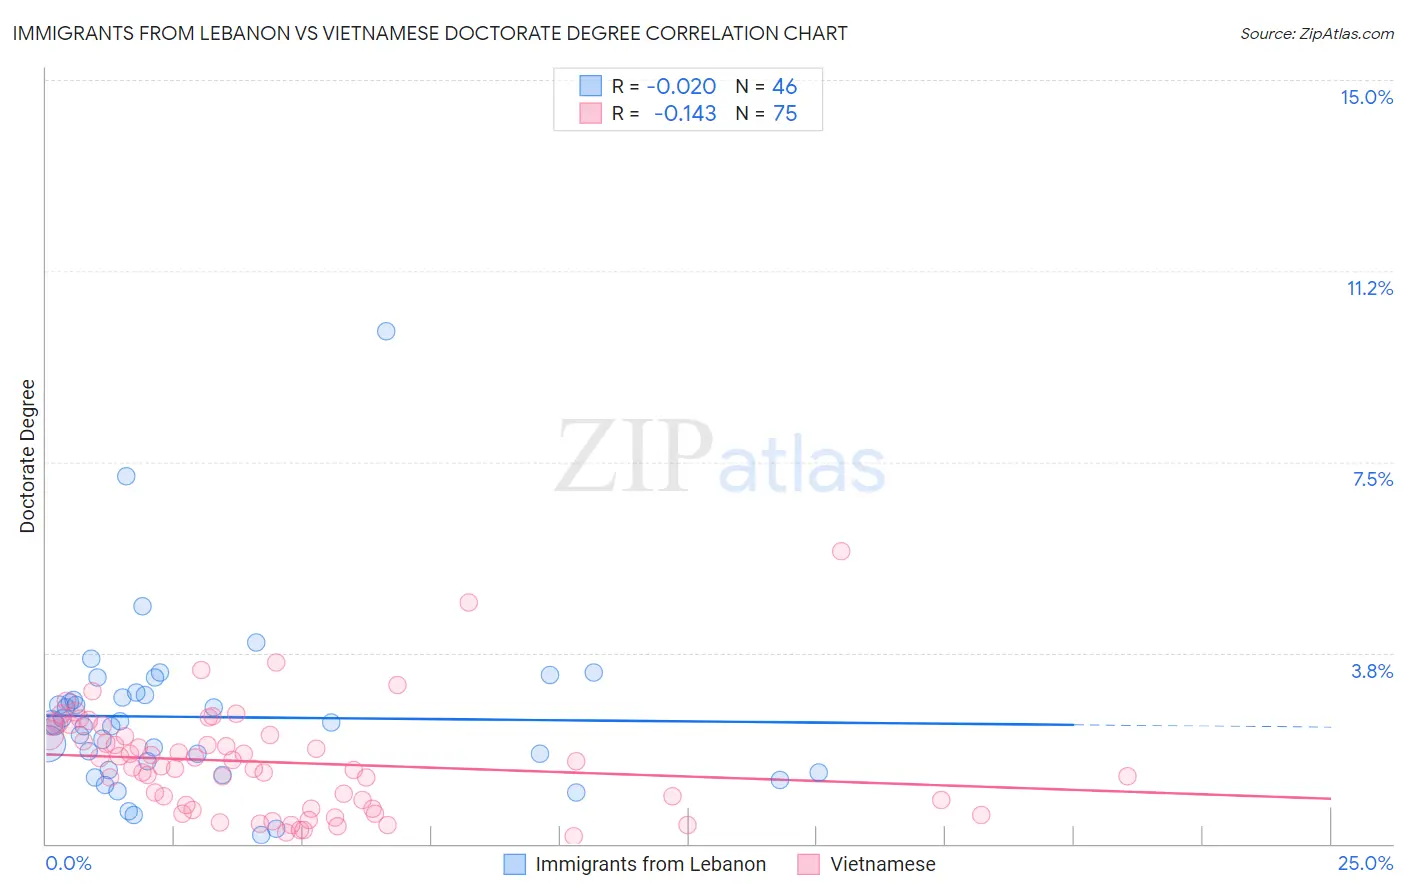
Immigrants from Lebanon vs Vietnamese Doctorate Degree Correlation Chart
The statistical analysis conducted on geographies consisting of 216,746,236 people shows no correlation between the proportion of Immigrants from Lebanon and percentage of population with at least doctorate degree education in the United States with a correlation coefficient (R) of -0.020 and weighted average of 2.2%. Similarly, the statistical analysis conducted on geographies consisting of 170,365,773 people shows a poor negative correlation between the proportion of Vietnamese and percentage of population with at least doctorate degree education in the United States with a correlation coefficient (R) of -0.143 and weighted average of 1.9%, a difference of 21.3%.
Doctorate Degree Correlation Summary
| Measurement | Immigrants from Lebanon | Vietnamese |
| Minimum | 0.17% | 0.14% |
| Maximum | 10.1% | 5.7% |
| Range | 9.9% | 5.6% |
| Mean | 2.5% | 1.6% |
| Median | 2.4% | 1.5% |
| Interquartile 25% (IQ1) | 1.4% | 0.69% |
| Interquartile 75% (IQ3) | 2.9% | 2.1% |
| Interquartile Range (IQR) | 1.5% | 1.4% |
| Standard Deviation (Sample) | 1.7% | 1.0% |
| Standard Deviation (Population) | 1.7% | 1.0% |
Similar Demographics by Doctorate Degree
Demographics Similar to Immigrants from Lebanon by Doctorate Degree
In terms of doctorate degree, the demographic groups most similar to Immigrants from Lebanon are Immigrants from Hungary (2.2%, a difference of 0.010%), Immigrants from Western Asia (2.2%, a difference of 0.080%), Immigrants from North America (2.2%, a difference of 0.18%), Immigrants from Bulgaria (2.3%, a difference of 0.32%), and Immigrants from Canada (2.3%, a difference of 0.40%).
| Demographics | Rating | Rank | Doctorate Degree |
| Lithuanians | 99.8 /100 | #70 | Exceptional 2.3% |
| Immigrants | Bolivia | 99.8 /100 | #71 | Exceptional 2.3% |
| Immigrants | Canada | 99.8 /100 | #72 | Exceptional 2.3% |
| Immigrants | Bulgaria | 99.8 /100 | #73 | Exceptional 2.3% |
| Immigrants | North America | 99.8 /100 | #74 | Exceptional 2.2% |
| Immigrants | Western Asia | 99.8 /100 | #75 | Exceptional 2.2% |
| Immigrants | Hungary | 99.8 /100 | #76 | Exceptional 2.2% |
| Immigrants | Lebanon | 99.8 /100 | #77 | Exceptional 2.2% |
| Immigrants | Belarus | 99.7 /100 | #78 | Exceptional 2.2% |
| Northern Europeans | 99.7 /100 | #79 | Exceptional 2.2% |
| Ugandans | 99.7 /100 | #80 | Exceptional 2.2% |
| Immigrants | Argentina | 99.7 /100 | #81 | Exceptional 2.2% |
| Immigrants | Uganda | 99.6 /100 | #82 | Exceptional 2.2% |
| Immigrants | Lithuania | 99.6 /100 | #83 | Exceptional 2.2% |
| Immigrants | England | 99.6 /100 | #84 | Exceptional 2.2% |
Demographics Similar to Vietnamese by Doctorate Degree
In terms of doctorate degree, the demographic groups most similar to Vietnamese are Costa Rican (1.8%, a difference of 0.22%), Bermudan (1.8%, a difference of 0.39%), Belgian (1.8%, a difference of 0.66%), Norwegian (1.8%, a difference of 0.70%), and Immigrants from Bangladesh (1.8%, a difference of 0.70%).
| Demographics | Rating | Rank | Doctorate Degree |
| Irish | 67.5 /100 | #162 | Good 1.9% |
| Czechs | 67.3 /100 | #163 | Good 1.9% |
| Celtics | 66.7 /100 | #164 | Good 1.9% |
| Scotch-Irish | 63.6 /100 | #165 | Good 1.9% |
| Spaniards | 63.5 /100 | #166 | Good 1.9% |
| Macedonians | 60.9 /100 | #167 | Good 1.9% |
| Sri Lankans | 60.3 /100 | #168 | Good 1.9% |
| Vietnamese | 54.8 /100 | #169 | Average 1.9% |
| Costa Ricans | 53.3 /100 | #170 | Average 1.8% |
| Bermudans | 52.1 /100 | #171 | Average 1.8% |
| Belgians | 50.3 /100 | #172 | Average 1.8% |
| Norwegians | 50.0 /100 | #173 | Average 1.8% |
| Immigrants | Bangladesh | 50.0 /100 | #174 | Average 1.8% |
| Immigrants | Thailand | 49.4 /100 | #175 | Average 1.8% |
| Spanish | 49.3 /100 | #176 | Average 1.8% |