German vs Pima High School Diploma
COMPARE
German
Pima
High School Diploma
High School Diploma Comparison
Germans
Pima
91.7%
HIGH SCHOOL DIPLOMA
99.9/ 100
METRIC RATING
18th/ 347
METRIC RANK
81.6%
HIGH SCHOOL DIPLOMA
0.0/ 100
METRIC RATING
339th/ 347
METRIC RANK
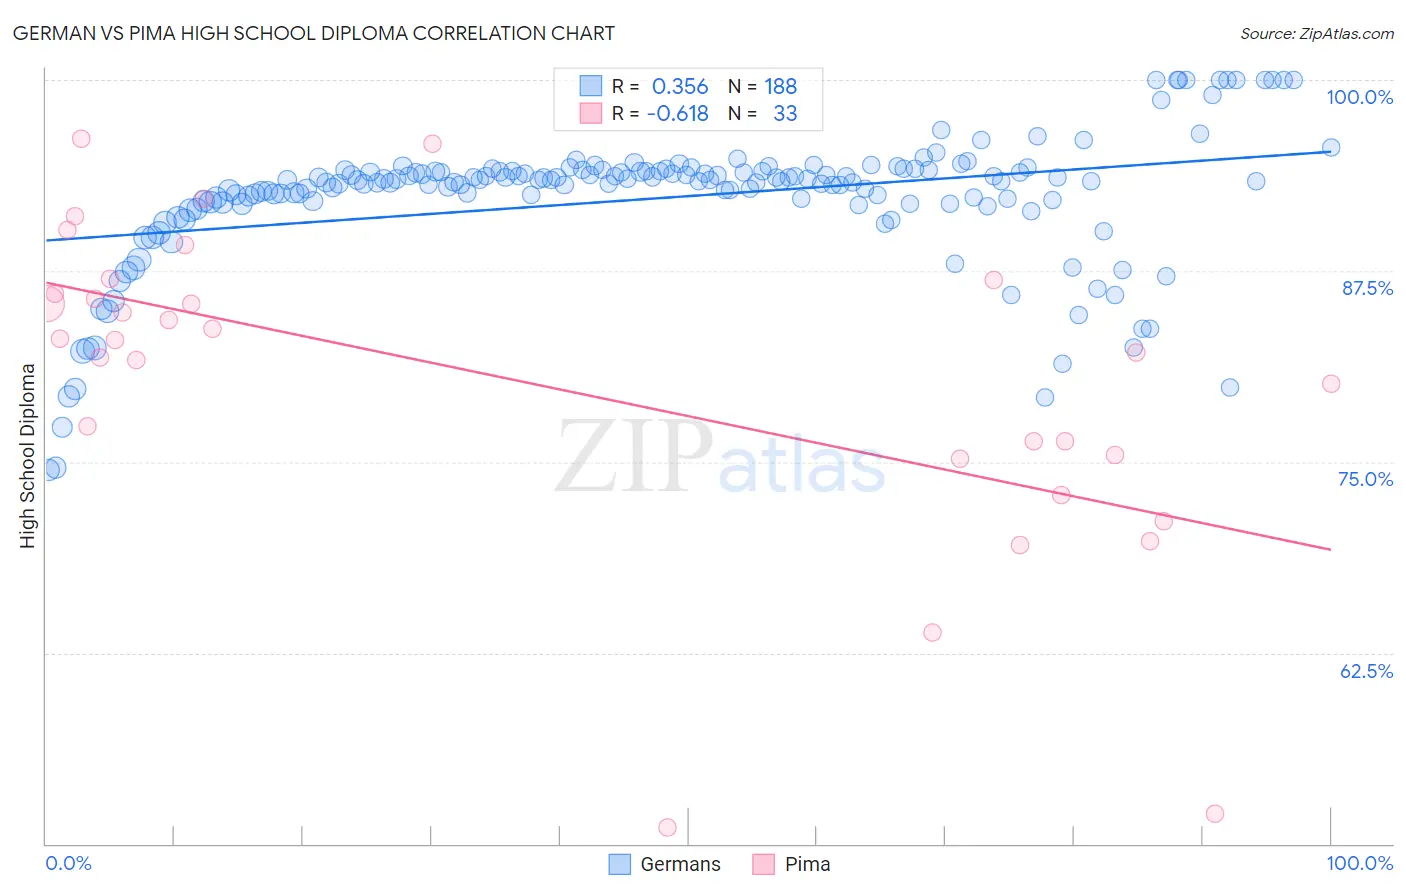
German vs Pima High School Diploma Correlation Chart
The statistical analysis conducted on geographies consisting of 581,301,082 people shows a mild positive correlation between the proportion of Germans and percentage of population with at least high school diploma education in the United States with a correlation coefficient (R) of 0.356 and weighted average of 91.7%. Similarly, the statistical analysis conducted on geographies consisting of 61,552,828 people shows a significant negative correlation between the proportion of Pima and percentage of population with at least high school diploma education in the United States with a correlation coefficient (R) of -0.618 and weighted average of 81.6%, a difference of 12.3%.
High School Diploma Correlation Summary
| Measurement | German | Pima |
| Minimum | 74.5% | 51.1% |
| Maximum | 100.0% | 96.1% |
| Range | 25.5% | 45.1% |
| Mean | 92.2% | 80.2% |
| Median | 93.4% | 83.0% |
| Interquartile 25% (IQ1) | 91.9% | 75.3% |
| Interquartile 75% (IQ3) | 94.0% | 86.4% |
| Interquartile Range (IQR) | 2.1% | 11.1% |
| Standard Deviation (Sample) | 4.5% | 10.6% |
| Standard Deviation (Population) | 4.5% | 10.4% |
Similar Demographics by High School Diploma
Demographics Similar to Germans by High School Diploma
In terms of high school diploma, the demographic groups most similar to Germans are Immigrants from Singapore (91.7%, a difference of 0.010%), Finnish (91.7%, a difference of 0.050%), Luxembourger (91.7%, a difference of 0.070%), Maltese (91.6%, a difference of 0.080%), and Bulgarian (91.8%, a difference of 0.10%).
| Demographics | Rating | Rank | High School Diploma |
| Eastern Europeans | 100.0 /100 | #11 | Exceptional 91.9% |
| Poles | 100.0 /100 | #12 | Exceptional 91.9% |
| Danes | 100.0 /100 | #13 | Exceptional 91.8% |
| Bulgarians | 100.0 /100 | #14 | Exceptional 91.8% |
| Luxembourgers | 100.0 /100 | #15 | Exceptional 91.7% |
| Finns | 100.0 /100 | #16 | Exceptional 91.7% |
| Immigrants | Singapore | 99.9 /100 | #17 | Exceptional 91.7% |
| Germans | 99.9 /100 | #18 | Exceptional 91.7% |
| Maltese | 99.9 /100 | #19 | Exceptional 91.6% |
| Czechs | 99.9 /100 | #20 | Exceptional 91.6% |
| Filipinos | 99.9 /100 | #21 | Exceptional 91.6% |
| Estonians | 99.9 /100 | #22 | Exceptional 91.6% |
| Scandinavians | 99.9 /100 | #23 | Exceptional 91.5% |
| Italians | 99.9 /100 | #24 | Exceptional 91.5% |
| Thais | 99.9 /100 | #25 | Exceptional 91.5% |
Demographics Similar to Pima by High School Diploma
In terms of high school diploma, the demographic groups most similar to Pima are Salvadoran (81.7%, a difference of 0.10%), Houma (81.5%, a difference of 0.11%), Mexican (81.4%, a difference of 0.26%), Immigrants from Yemen (81.8%, a difference of 0.27%), and Immigrants from Guatemala (81.4%, a difference of 0.31%).
| Demographics | Rating | Rank | High School Diploma |
| Immigrants | Honduras | 0.0 /100 | #332 | Tragic 82.5% |
| Immigrants | Latin America | 0.0 /100 | #333 | Tragic 82.1% |
| Tohono O'odham | 0.0 /100 | #334 | Tragic 82.1% |
| Guatemalans | 0.0 /100 | #335 | Tragic 82.0% |
| Immigrants | Dominican Republic | 0.0 /100 | #336 | Tragic 82.0% |
| Immigrants | Yemen | 0.0 /100 | #337 | Tragic 81.8% |
| Salvadorans | 0.0 /100 | #338 | Tragic 81.7% |
| Pima | 0.0 /100 | #339 | Tragic 81.6% |
| Houma | 0.0 /100 | #340 | Tragic 81.5% |
| Mexicans | 0.0 /100 | #341 | Tragic 81.4% |
| Immigrants | Guatemala | 0.0 /100 | #342 | Tragic 81.4% |
| Immigrants | El Salvador | 0.0 /100 | #343 | Tragic 80.8% |
| Immigrants | Central America | 0.0 /100 | #344 | Tragic 80.1% |
| Yakama | 0.0 /100 | #345 | Tragic 80.0% |
| Spanish American Indians | 0.0 /100 | #346 | Tragic 79.8% |