German vs Immigrants from Colombia College, 1 year or more
COMPARE
German
Immigrants from Colombia
College, 1 year or more
College, 1 year or more Comparison
Germans
Immigrants from Colombia
58.9%
COLLEGE, 1 YEAR OR MORE
34.7/ 100
METRIC RATING
187th/ 347
METRIC RANK
57.8%
COLLEGE, 1 YEAR OR MORE
11.6/ 100
METRIC RATING
214th/ 347
METRIC RANK
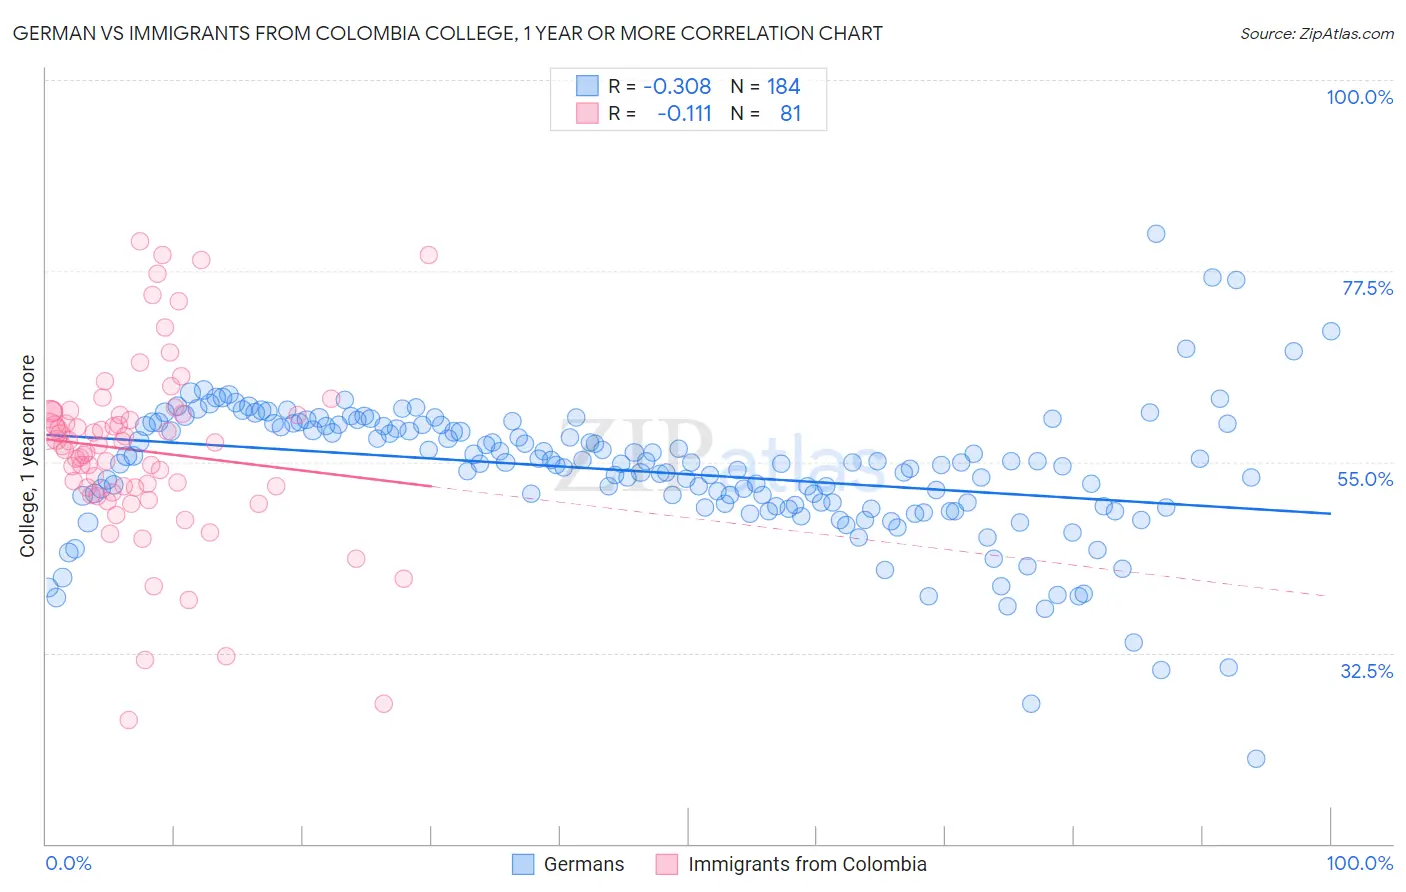
German vs Immigrants from Colombia College, 1 year or more Correlation Chart
The statistical analysis conducted on geographies consisting of 581,271,731 people shows a mild negative correlation between the proportion of Germans and percentage of population with at least college, 1 year or more education in the United States with a correlation coefficient (R) of -0.308 and weighted average of 58.9%. Similarly, the statistical analysis conducted on geographies consisting of 378,687,641 people shows a poor negative correlation between the proportion of Immigrants from Colombia and percentage of population with at least college, 1 year or more education in the United States with a correlation coefficient (R) of -0.111 and weighted average of 57.8%, a difference of 1.9%.
College, 1 year or more Correlation Summary
| Measurement | German | Immigrants from Colombia |
| Minimum | 20.0% | 24.6% |
| Maximum | 81.8% | 81.0% |
| Range | 61.8% | 56.4% |
| Mean | 53.9% | 56.3% |
| Median | 54.9% | 57.0% |
| Interquartile 25% (IQ1) | 49.8% | 51.7% |
| Interquartile 75% (IQ3) | 59.4% | 60.7% |
| Interquartile Range (IQR) | 9.6% | 9.0% |
| Standard Deviation (Sample) | 8.2% | 10.7% |
| Standard Deviation (Population) | 8.1% | 10.6% |
Similar Demographics by College, 1 year or more
Demographics Similar to Germans by College, 1 year or more
In terms of college, 1 year or more, the demographic groups most similar to Germans are Scotch-Irish (58.9%, a difference of 0.0%), French (58.9%, a difference of 0.020%), South American (59.0%, a difference of 0.070%), Uruguayan (58.8%, a difference of 0.17%), and Spaniard (59.0%, a difference of 0.21%).
| Demographics | Rating | Rank | College, 1 year or more |
| Yugoslavians | 44.1 /100 | #180 | Average 59.2% |
| Swiss | 43.4 /100 | #181 | Average 59.2% |
| Immigrants | Bosnia and Herzegovina | 42.8 /100 | #182 | Average 59.2% |
| German Russians | 39.3 /100 | #183 | Fair 59.1% |
| Spaniards | 38.3 /100 | #184 | Fair 59.0% |
| South Americans | 35.9 /100 | #185 | Fair 59.0% |
| Scotch-Irish | 34.7 /100 | #186 | Fair 58.9% |
| Germans | 34.7 /100 | #187 | Fair 58.9% |
| French | 34.4 /100 | #188 | Fair 58.9% |
| Uruguayans | 31.8 /100 | #189 | Fair 58.8% |
| Immigrants | Cameroon | 31.2 /100 | #190 | Fair 58.8% |
| Immigrants | Philippines | 29.2 /100 | #191 | Fair 58.7% |
| Colombians | 27.6 /100 | #192 | Fair 58.7% |
| Peruvians | 27.5 /100 | #193 | Fair 58.6% |
| Costa Ricans | 26.4 /100 | #194 | Fair 58.6% |
Demographics Similar to Immigrants from Colombia by College, 1 year or more
In terms of college, 1 year or more, the demographic groups most similar to Immigrants from Colombia are Tongan (57.8%, a difference of 0.0%), Immigrants from Senegal (57.8%, a difference of 0.030%), French Canadian (57.8%, a difference of 0.030%), Immigrants from Peru (57.7%, a difference of 0.14%), and Immigrants from Nigeria (57.9%, a difference of 0.21%).
| Demographics | Rating | Rank | College, 1 year or more |
| Senegalese | 16.9 /100 | #207 | Poor 58.2% |
| Immigrants | Uruguay | 15.2 /100 | #208 | Poor 58.1% |
| Immigrants | Middle Africa | 14.0 /100 | #209 | Poor 58.0% |
| Tsimshian | 13.5 /100 | #210 | Poor 57.9% |
| Immigrants | Nigeria | 13.3 /100 | #211 | Poor 57.9% |
| Immigrants | Senegal | 11.8 /100 | #212 | Poor 57.8% |
| French Canadians | 11.8 /100 | #213 | Poor 57.8% |
| Immigrants | Colombia | 11.6 /100 | #214 | Poor 57.8% |
| Tongans | 11.6 /100 | #215 | Poor 57.8% |
| Immigrants | Peru | 10.6 /100 | #216 | Poor 57.7% |
| Immigrants | Panama | 9.1 /100 | #217 | Tragic 57.6% |
| Native Hawaiians | 9.0 /100 | #218 | Tragic 57.6% |
| Whites/Caucasians | 8.7 /100 | #219 | Tragic 57.6% |
| Immigrants | Costa Rica | 8.0 /100 | #220 | Tragic 57.5% |
| Immigrants | Ghana | 7.7 /100 | #221 | Tragic 57.4% |