British vs Apache Kindergarten
COMPARE
British
Apache
Kindergarten
Kindergarten Comparison
British
Apache
98.5%
KINDERGARTEN
99.9/ 100
METRIC RATING
36th/ 347
METRIC RANK
98.0%
KINDERGARTEN
75.0/ 100
METRIC RATING
148th/ 347
METRIC RANK
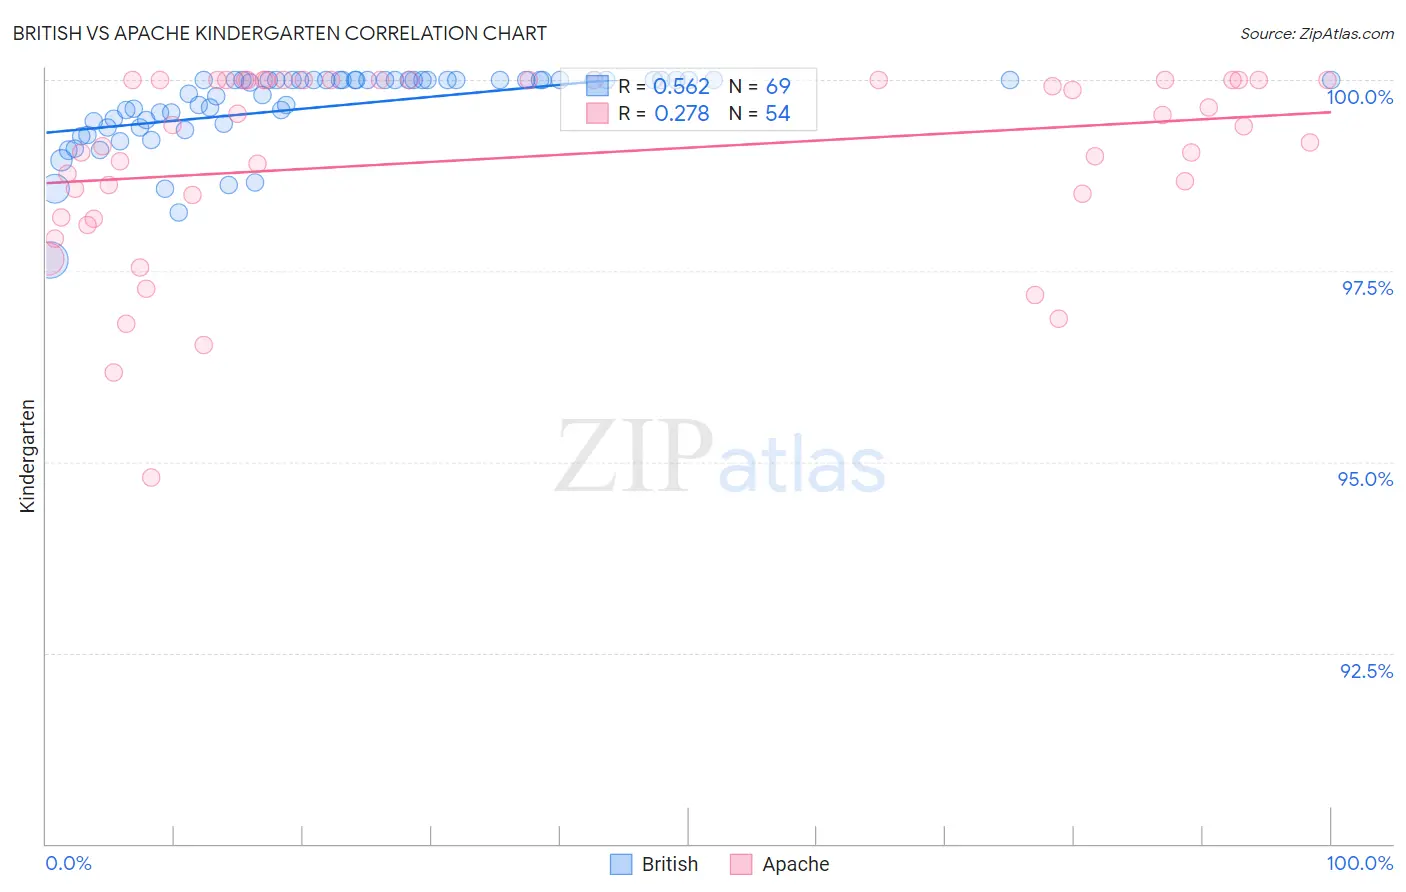
British vs Apache Kindergarten Correlation Chart
The statistical analysis conducted on geographies consisting of 531,462,526 people shows a substantial positive correlation between the proportion of British and percentage of population with at least kindergarten education in the United States with a correlation coefficient (R) of 0.562 and weighted average of 98.5%. Similarly, the statistical analysis conducted on geographies consisting of 231,142,814 people shows a weak positive correlation between the proportion of Apache and percentage of population with at least kindergarten education in the United States with a correlation coefficient (R) of 0.278 and weighted average of 98.0%, a difference of 0.50%.
Kindergarten Correlation Summary
| Measurement | British | Apache |
| Minimum | 97.6% | 94.8% |
| Maximum | 100.0% | 100.0% |
| Range | 2.4% | 5.2% |
| Mean | 99.6% | 99.0% |
| Median | 100.0% | 99.4% |
| Interquartile 25% (IQ1) | 99.4% | 98.5% |
| Interquartile 75% (IQ3) | 100.0% | 100.0% |
| Interquartile Range (IQR) | 0.59% | 1.5% |
| Standard Deviation (Sample) | 0.51% | 1.2% |
| Standard Deviation (Population) | 0.50% | 1.2% |
Similar Demographics by Kindergarten
Demographics Similar to British by Kindergarten
In terms of kindergarten, the demographic groups most similar to British are Chinese (98.5%, a difference of 0.020%), Swiss (98.5%, a difference of 0.020%), Italian (98.5%, a difference of 0.020%), Latvian (98.5%, a difference of 0.020%), and Chippewa (98.5%, a difference of 0.030%).
| Demographics | Rating | Rank | Kindergarten |
| French | 100.0 /100 | #29 | Exceptional 98.6% |
| Europeans | 100.0 /100 | #30 | Exceptional 98.6% |
| Czechs | 100.0 /100 | #31 | Exceptional 98.6% |
| French Canadians | 100.0 /100 | #32 | Exceptional 98.6% |
| Scandinavians | 100.0 /100 | #33 | Exceptional 98.6% |
| Chinese | 100.0 /100 | #34 | Exceptional 98.5% |
| Swiss | 100.0 /100 | #35 | Exceptional 98.5% |
| British | 99.9 /100 | #36 | Exceptional 98.5% |
| Italians | 99.9 /100 | #37 | Exceptional 98.5% |
| Latvians | 99.9 /100 | #38 | Exceptional 98.5% |
| Chippewa | 99.9 /100 | #39 | Exceptional 98.5% |
| Luxembourgers | 99.9 /100 | #40 | Exceptional 98.5% |
| Eastern Europeans | 99.9 /100 | #41 | Exceptional 98.5% |
| Native Hawaiians | 99.9 /100 | #42 | Exceptional 98.5% |
| Lumbee | 99.9 /100 | #43 | Exceptional 98.5% |
Demographics Similar to Apache by Kindergarten
In terms of kindergarten, the demographic groups most similar to Apache are Immigrants from Greece (98.0%, a difference of 0.0%), Filipino (98.0%, a difference of 0.010%), Immigrants from Israel (98.0%, a difference of 0.010%), Jordanian (98.0%, a difference of 0.010%), and Alsatian (98.1%, a difference of 0.020%).
| Demographics | Rating | Rank | Kindergarten |
| Marshallese | 83.0 /100 | #141 | Excellent 98.1% |
| Immigrants | Turkey | 82.8 /100 | #142 | Excellent 98.1% |
| Burmese | 81.5 /100 | #143 | Excellent 98.1% |
| Alsatians | 80.4 /100 | #144 | Excellent 98.1% |
| Hmong | 78.8 /100 | #145 | Good 98.1% |
| Filipinos | 78.3 /100 | #146 | Good 98.0% |
| Immigrants | Israel | 77.6 /100 | #147 | Good 98.0% |
| Apache | 75.0 /100 | #148 | Good 98.0% |
| Immigrants | Greece | 74.9 /100 | #149 | Good 98.0% |
| Jordanians | 72.8 /100 | #150 | Good 98.0% |
| Soviet Union | 70.8 /100 | #151 | Good 98.0% |
| Dutch West Indians | 70.1 /100 | #152 | Good 98.0% |
| Immigrants | Moldova | 69.1 /100 | #153 | Good 98.0% |
| Immigrants | Iran | 68.8 /100 | #154 | Good 98.0% |
| Comanche | 68.3 /100 | #155 | Good 98.0% |