French vs Immigrants from Western Asia Unemployment Among Ages 45 to 54 years
COMPARE
French
Immigrants from Western Asia
Unemployment Among Ages 45 to 54 years
Unemployment Among Ages 45 to 54 years Comparison
French
Immigrants from Western Asia
4.3%
UNEMPLOYMENT AMONG AGES 45 TO 54 YEARS
97.3/ 100
METRIC RATING
85th/ 347
METRIC RANK
4.8%
UNEMPLOYMENT AMONG AGES 45 TO 54 YEARS
0.2/ 100
METRIC RATING
256th/ 347
METRIC RANK
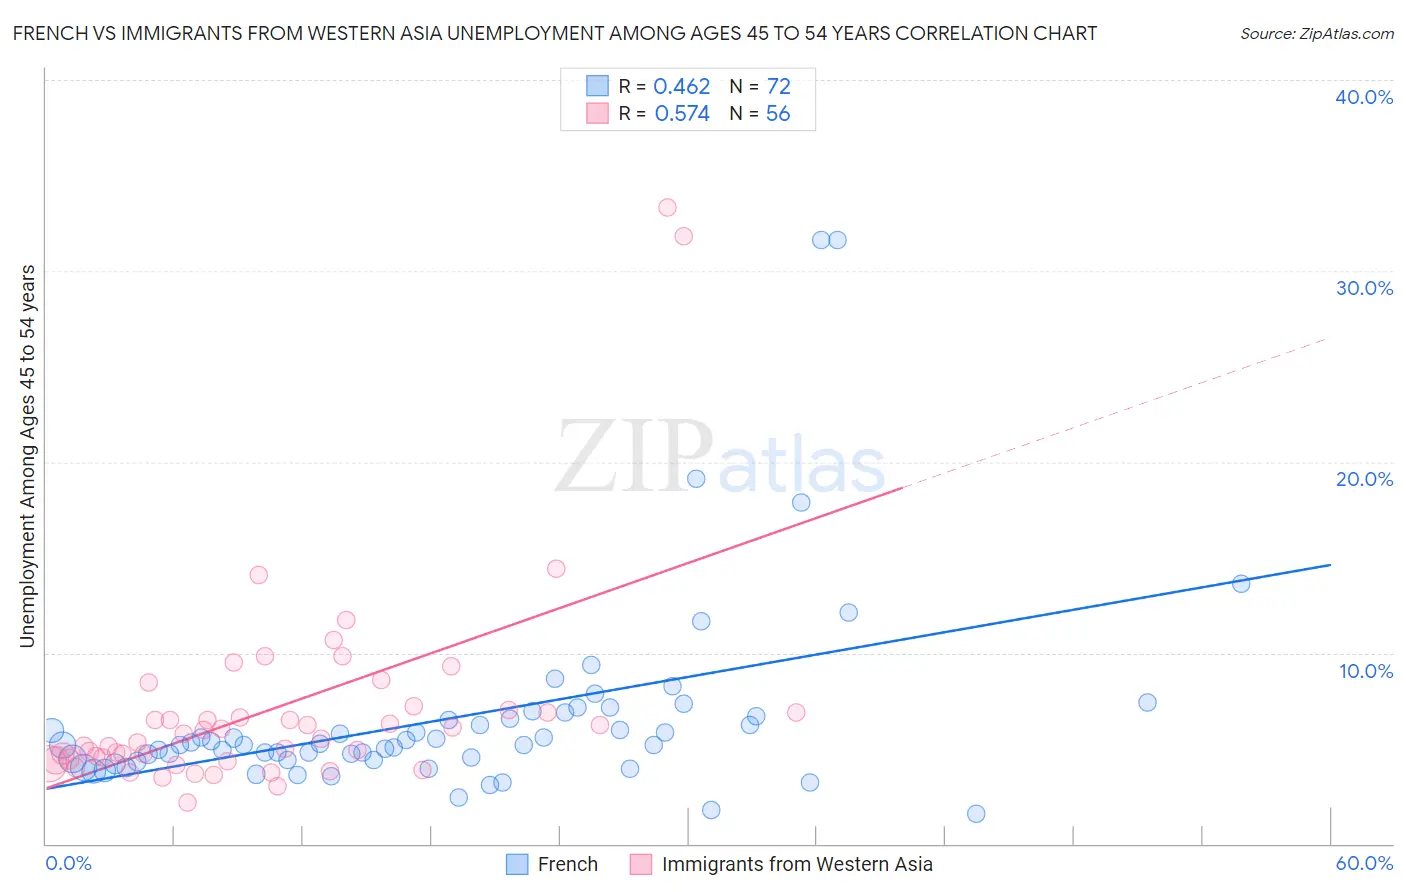
French vs Immigrants from Western Asia Unemployment Among Ages 45 to 54 years Correlation Chart
The statistical analysis conducted on geographies consisting of 529,343,979 people shows a moderate positive correlation between the proportion of French and unemployment rate among population between the ages 45 and 54 in the United States with a correlation coefficient (R) of 0.462 and weighted average of 4.3%. Similarly, the statistical analysis conducted on geographies consisting of 395,058,166 people shows a substantial positive correlation between the proportion of Immigrants from Western Asia and unemployment rate among population between the ages 45 and 54 in the United States with a correlation coefficient (R) of 0.574 and weighted average of 4.8%, a difference of 11.9%.
Unemployment Among Ages 45 to 54 years Correlation Summary
| Measurement | French | Immigrants from Western Asia |
| Minimum | 1.6% | 2.2% |
| Maximum | 31.6% | 33.3% |
| Range | 30.0% | 31.1% |
| Mean | 6.6% | 7.0% |
| Median | 5.2% | 5.6% |
| Interquartile 25% (IQ1) | 4.4% | 4.4% |
| Interquartile 75% (IQ3) | 6.6% | 7.0% |
| Interquartile Range (IQR) | 2.2% | 2.5% |
| Standard Deviation (Sample) | 5.2% | 5.6% |
| Standard Deviation (Population) | 5.2% | 5.5% |
Similar Demographics by Unemployment Among Ages 45 to 54 years
Demographics Similar to French by Unemployment Among Ages 45 to 54 years
In terms of unemployment among ages 45 to 54 years, the demographic groups most similar to French are Italian (4.3%, a difference of 0.0%), Australian (4.3%, a difference of 0.040%), Ethiopian (4.3%, a difference of 0.040%), Eastern European (4.3%, a difference of 0.12%), and Sudanese (4.3%, a difference of 0.14%).
| Demographics | Rating | Rank | Unemployment Among Ages 45 to 54 years |
| German Russians | 97.9 /100 | #78 | Exceptional 4.3% |
| Serbians | 97.9 /100 | #79 | Exceptional 4.3% |
| Cambodians | 97.8 /100 | #80 | Exceptional 4.3% |
| Immigrants | Micronesia | 97.6 /100 | #81 | Exceptional 4.3% |
| Eastern Europeans | 97.6 /100 | #82 | Exceptional 4.3% |
| Australians | 97.4 /100 | #83 | Exceptional 4.3% |
| Italians | 97.3 /100 | #84 | Exceptional 4.3% |
| French | 97.3 /100 | #85 | Exceptional 4.3% |
| Ethiopians | 97.2 /100 | #86 | Exceptional 4.3% |
| Sudanese | 97.0 /100 | #87 | Exceptional 4.3% |
| Immigrants | Turkey | 96.9 /100 | #88 | Exceptional 4.3% |
| Immigrants | Argentina | 96.9 /100 | #89 | Exceptional 4.3% |
| Asians | 96.8 /100 | #90 | Exceptional 4.3% |
| Ukrainians | 96.6 /100 | #91 | Exceptional 4.3% |
| Mongolians | 96.6 /100 | #92 | Exceptional 4.3% |
Demographics Similar to Immigrants from Western Asia by Unemployment Among Ages 45 to 54 years
In terms of unemployment among ages 45 to 54 years, the demographic groups most similar to Immigrants from Western Asia are Immigrants from El Salvador (4.8%, a difference of 0.080%), Immigrants from Western Africa (4.9%, a difference of 0.15%), Subsaharan African (4.9%, a difference of 0.18%), Immigrants from Lebanon (4.8%, a difference of 0.20%), and Ugandan (4.9%, a difference of 0.33%).
| Demographics | Rating | Rank | Unemployment Among Ages 45 to 54 years |
| Immigrants | Honduras | 0.7 /100 | #249 | Tragic 4.8% |
| Salvadorans | 0.7 /100 | #250 | Tragic 4.8% |
| Hondurans | 0.4 /100 | #251 | Tragic 4.8% |
| Immigrants | Bahamas | 0.3 /100 | #252 | Tragic 4.8% |
| Moroccans | 0.3 /100 | #253 | Tragic 4.8% |
| Immigrants | Lebanon | 0.2 /100 | #254 | Tragic 4.8% |
| Immigrants | El Salvador | 0.2 /100 | #255 | Tragic 4.8% |
| Immigrants | Western Asia | 0.2 /100 | #256 | Tragic 4.8% |
| Immigrants | Western Africa | 0.2 /100 | #257 | Tragic 4.9% |
| Sub-Saharan Africans | 0.2 /100 | #258 | Tragic 4.9% |
| Ugandans | 0.1 /100 | #259 | Tragic 4.9% |
| Mexican American Indians | 0.1 /100 | #260 | Tragic 4.9% |
| Guatemalans | 0.1 /100 | #261 | Tragic 4.9% |
| Mexicans | 0.1 /100 | #262 | Tragic 4.9% |
| Immigrants | Fiji | 0.1 /100 | #263 | Tragic 4.9% |