Finnish vs Immigrants from North Macedonia 8th Grade
COMPARE
Finnish
Immigrants from North Macedonia
8th Grade
8th Grade Comparison
Finns
Immigrants from North Macedonia
98.4%
8TH GRADE
100.0/ 100
METRIC RATING
3rd/ 347
METRIC RANK
96.3%
8TH GRADE
98.0/ 100
METRIC RATING
105th/ 347
METRIC RANK
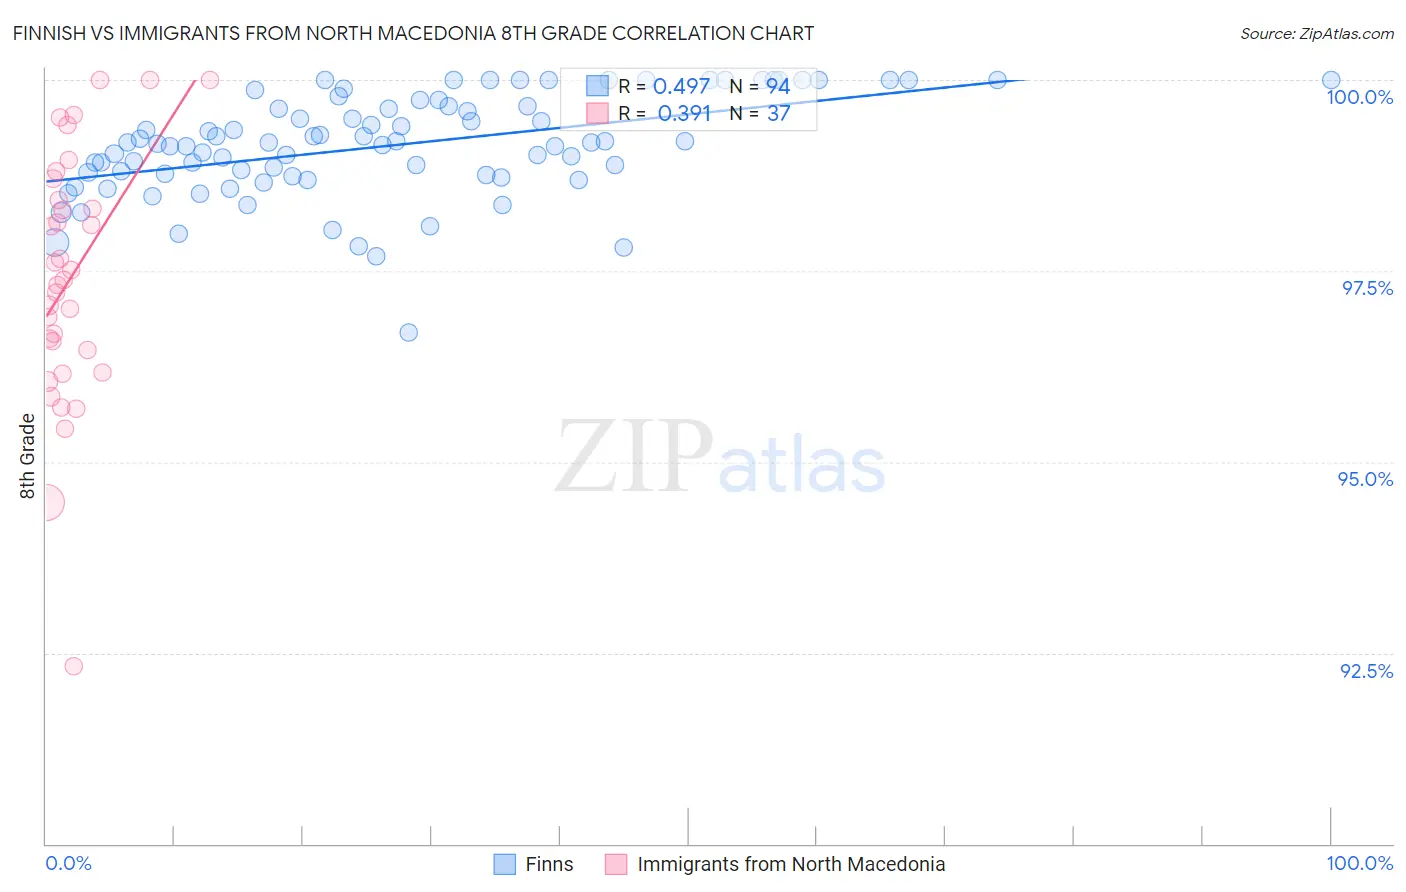
Finnish vs Immigrants from North Macedonia 8th Grade Correlation Chart
The statistical analysis conducted on geographies consisting of 46,910,222 people shows a moderate positive correlation between the proportion of Finns and percentage of population with at least 8th grade education in the United States with a correlation coefficient (R) of 0.497 and weighted average of 98.4%. Similarly, the statistical analysis conducted on geographies consisting of 74,252,242 people shows a mild positive correlation between the proportion of Immigrants from North Macedonia and percentage of population with at least 8th grade education in the United States with a correlation coefficient (R) of 0.391 and weighted average of 96.3%, a difference of 2.1%.
8th Grade Correlation Summary
| Measurement | Finnish | Immigrants from North Macedonia |
| Minimum | 96.7% | 92.3% |
| Maximum | 100.0% | 100.0% |
| Range | 3.3% | 7.7% |
| Mean | 99.1% | 97.4% |
| Median | 99.2% | 97.4% |
| Interquartile 25% (IQ1) | 98.8% | 96.3% |
| Interquartile 75% (IQ3) | 99.7% | 98.6% |
| Interquartile Range (IQR) | 0.90% | 2.2% |
| Standard Deviation (Sample) | 0.67% | 1.7% |
| Standard Deviation (Population) | 0.66% | 1.6% |
Similar Demographics by 8th Grade
Demographics Similar to Finns by 8th Grade
In terms of 8th grade, the demographic groups most similar to Finns are Carpatho Rusyn (98.1%, a difference of 0.23%), Ottawa (97.9%, a difference of 0.43%), Tsimshian (99.0%, a difference of 0.60%), Crow (99.0%, a difference of 0.69%), and Dutch (97.7%, a difference of 0.72%).
| Demographics | Rating | Rank | 8th Grade |
| Crow | 100.0 /100 | #1 | Exceptional 99.0% |
| Tsimshian | 100.0 /100 | #2 | Exceptional 99.0% |
| Finns | 100.0 /100 | #3 | Exceptional 98.4% |
| Carpatho Rusyns | 100.0 /100 | #4 | Exceptional 98.1% |
| Ottawa | 100.0 /100 | #5 | Exceptional 97.9% |
| Dutch | 100.0 /100 | #6 | Exceptional 97.7% |
| Norwegians | 100.0 /100 | #7 | Exceptional 97.6% |
| Slovaks | 100.0 /100 | #8 | Exceptional 97.6% |
| Germans | 100.0 /100 | #9 | Exceptional 97.5% |
| Slovenes | 100.0 /100 | #10 | Exceptional 97.5% |
| Poles | 100.0 /100 | #11 | Exceptional 97.4% |
| Swedes | 100.0 /100 | #12 | Exceptional 97.4% |
| Alaskan Athabascans | 100.0 /100 | #13 | Exceptional 97.3% |
| English | 100.0 /100 | #14 | Exceptional 97.3% |
| Pennsylvania Germans | 100.0 /100 | #15 | Exceptional 97.3% |
Demographics Similar to Immigrants from North Macedonia by 8th Grade
In terms of 8th grade, the demographic groups most similar to Immigrants from North Macedonia are Immigrants from Saudi Arabia (96.3%, a difference of 0.0%), Kiowa (96.3%, a difference of 0.0%), Okinawan (96.3%, a difference of 0.0%), South African (96.4%, a difference of 0.010%), and Immigrants from Latvia (96.3%, a difference of 0.010%).
| Demographics | Rating | Rank | 8th Grade |
| Immigrants | Germany | 98.7 /100 | #98 | Exceptional 96.4% |
| Cree | 98.6 /100 | #99 | Exceptional 96.4% |
| Immigrants | Czechoslovakia | 98.6 /100 | #100 | Exceptional 96.4% |
| Bhutanese | 98.2 /100 | #101 | Exceptional 96.4% |
| South Africans | 98.2 /100 | #102 | Exceptional 96.4% |
| Immigrants | Saudi Arabia | 98.0 /100 | #103 | Exceptional 96.3% |
| Kiowa | 98.0 /100 | #104 | Exceptional 96.3% |
| Immigrants | North Macedonia | 98.0 /100 | #105 | Exceptional 96.3% |
| Okinawans | 98.0 /100 | #106 | Exceptional 96.3% |
| Immigrants | Latvia | 97.8 /100 | #107 | Exceptional 96.3% |
| Lebanese | 97.5 /100 | #108 | Exceptional 96.3% |
| Iroquois | 97.5 /100 | #109 | Exceptional 96.3% |
| Cajuns | 97.1 /100 | #110 | Exceptional 96.3% |
| Shoshone | 96.8 /100 | #111 | Exceptional 96.3% |
| Syrians | 96.7 /100 | #112 | Exceptional 96.3% |