Filipino vs Navajo Associate's Degree
COMPARE
Filipino
Navajo
Associate's Degree
Associate's Degree Comparison
Filipinos
Navajo
59.8%
ASSOCIATE'S DEGREE
100.0/ 100
METRIC RATING
1st/ 347
METRIC RANK
32.6%
ASSOCIATE'S DEGREE
0.0/ 100
METRIC RATING
340th/ 347
METRIC RANK
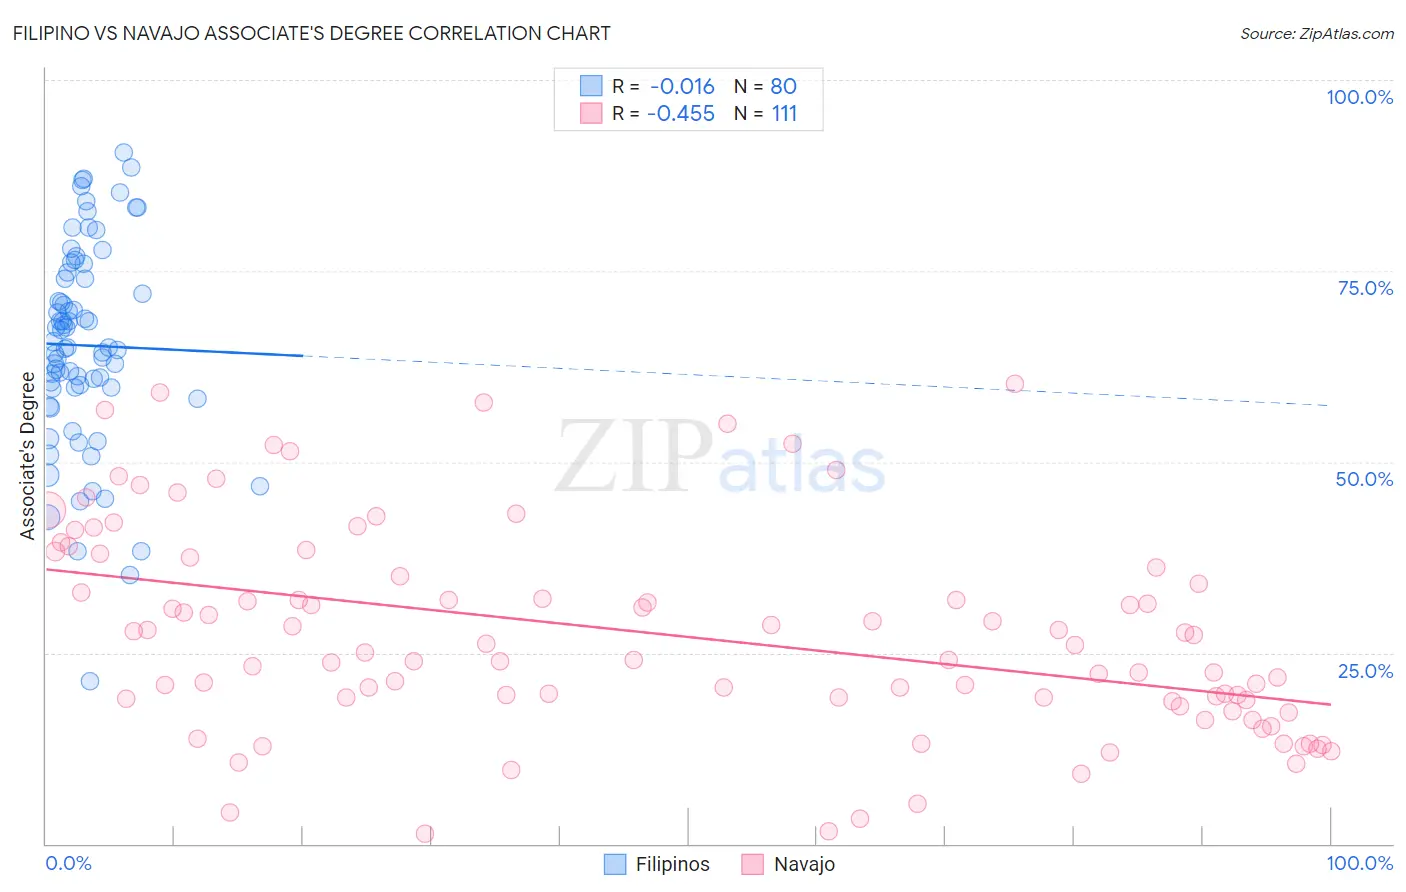
Filipino vs Navajo Associate's Degree Correlation Chart
The statistical analysis conducted on geographies consisting of 254,337,502 people shows no correlation between the proportion of Filipinos and percentage of population with at least associate's degree education in the United States with a correlation coefficient (R) of -0.016 and weighted average of 59.8%. Similarly, the statistical analysis conducted on geographies consisting of 224,870,654 people shows a moderate negative correlation between the proportion of Navajo and percentage of population with at least associate's degree education in the United States with a correlation coefficient (R) of -0.455 and weighted average of 32.6%, a difference of 83.5%.
Associate's Degree Correlation Summary
| Measurement | Filipino | Navajo |
| Minimum | 21.2% | 1.3% |
| Maximum | 90.5% | 60.2% |
| Range | 69.3% | 58.9% |
| Mean | 65.3% | 27.4% |
| Median | 65.0% | 25.1% |
| Interquartile 25% (IQ1) | 59.7% | 18.8% |
| Interquartile 75% (IQ3) | 74.4% | 36.2% |
| Interquartile Range (IQR) | 14.7% | 17.4% |
| Standard Deviation (Sample) | 13.5% | 13.5% |
| Standard Deviation (Population) | 13.4% | 13.4% |
Similar Demographics by Associate's Degree
Demographics Similar to Filipinos by Associate's Degree
In terms of associate's degree, the demographic groups most similar to Filipinos are Immigrants from Singapore (58.9%, a difference of 1.5%), Immigrants from India (58.5%, a difference of 2.1%), Immigrants from Taiwan (58.4%, a difference of 2.4%), Iranian (58.2%, a difference of 2.8%), and Okinawan (57.7%, a difference of 3.7%).
| Demographics | Rating | Rank | Associate's Degree |
| Filipinos | 100.0 /100 | #1 | Exceptional 59.8% |
| Immigrants | Singapore | 100.0 /100 | #2 | Exceptional 58.9% |
| Immigrants | India | 100.0 /100 | #3 | Exceptional 58.5% |
| Immigrants | Taiwan | 100.0 /100 | #4 | Exceptional 58.4% |
| Iranians | 100.0 /100 | #5 | Exceptional 58.2% |
| Okinawans | 100.0 /100 | #6 | Exceptional 57.7% |
| Immigrants | Iran | 100.0 /100 | #7 | Exceptional 57.7% |
| Thais | 100.0 /100 | #8 | Exceptional 57.4% |
| Immigrants | Israel | 100.0 /100 | #9 | Exceptional 56.8% |
| Cypriots | 100.0 /100 | #10 | Exceptional 56.4% |
| Immigrants | Australia | 100.0 /100 | #11 | Exceptional 55.8% |
| Immigrants | South Central Asia | 100.0 /100 | #12 | Exceptional 55.7% |
| Immigrants | China | 100.0 /100 | #13 | Exceptional 55.5% |
| Immigrants | Hong Kong | 100.0 /100 | #14 | Exceptional 55.4% |
| Immigrants | Eastern Asia | 100.0 /100 | #15 | Exceptional 55.4% |
Demographics Similar to Navajo by Associate's Degree
In terms of associate's degree, the demographic groups most similar to Navajo are Inupiat (32.6%, a difference of 0.050%), Yakama (32.3%, a difference of 0.83%), Tohono O'odham (31.8%, a difference of 2.5%), Immigrants from Mexico (33.7%, a difference of 3.5%), and Pueblo (34.0%, a difference of 4.3%).
| Demographics | Rating | Rank | Associate's Degree |
| Mexicans | 0.0 /100 | #333 | Tragic 35.0% |
| Natives/Alaskans | 0.0 /100 | #334 | Tragic 34.9% |
| Spanish American Indians | 0.0 /100 | #335 | Tragic 34.9% |
| Hopi | 0.0 /100 | #336 | Tragic 34.6% |
| Lumbee | 0.0 /100 | #337 | Tragic 34.1% |
| Pueblo | 0.0 /100 | #338 | Tragic 34.0% |
| Immigrants | Mexico | 0.0 /100 | #339 | Tragic 33.7% |
| Navajo | 0.0 /100 | #340 | Tragic 32.6% |
| Inupiat | 0.0 /100 | #341 | Tragic 32.6% |
| Yakama | 0.0 /100 | #342 | Tragic 32.3% |
| Tohono O'odham | 0.0 /100 | #343 | Tragic 31.8% |
| Yuman | 0.0 /100 | #344 | Tragic 31.3% |
| Pima | 0.0 /100 | #345 | Tragic 30.2% |
| Houma | 0.0 /100 | #346 | Tragic 28.2% |
| Yup'ik | 0.0 /100 | #347 | Tragic 25.0% |