Moroccan vs Navajo Associate's Degree
COMPARE
Moroccan
Navajo
Associate's Degree
Associate's Degree Comparison
Moroccans
Navajo
48.2%
ASSOCIATE'S DEGREE
89.3/ 100
METRIC RATING
134th/ 347
METRIC RANK
32.6%
ASSOCIATE'S DEGREE
0.0/ 100
METRIC RATING
340th/ 347
METRIC RANK
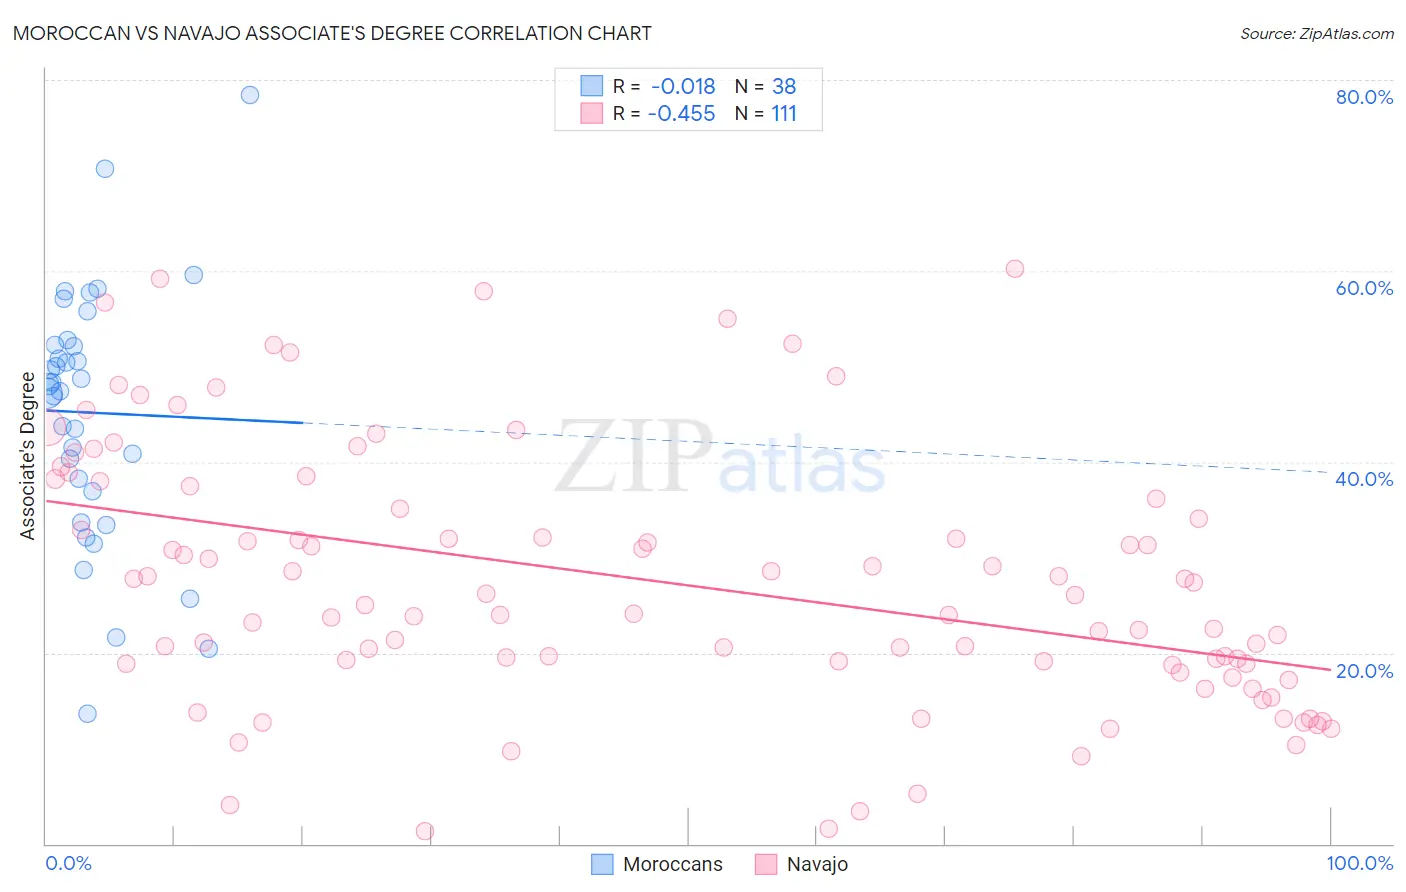
Moroccan vs Navajo Associate's Degree Correlation Chart
The statistical analysis conducted on geographies consisting of 201,815,061 people shows no correlation between the proportion of Moroccans and percentage of population with at least associate's degree education in the United States with a correlation coefficient (R) of -0.018 and weighted average of 48.2%. Similarly, the statistical analysis conducted on geographies consisting of 224,870,654 people shows a moderate negative correlation between the proportion of Navajo and percentage of population with at least associate's degree education in the United States with a correlation coefficient (R) of -0.455 and weighted average of 32.6%, a difference of 47.9%.
Associate's Degree Correlation Summary
| Measurement | Moroccan | Navajo |
| Minimum | 13.6% | 1.3% |
| Maximum | 78.5% | 60.2% |
| Range | 64.9% | 58.9% |
| Mean | 45.2% | 27.4% |
| Median | 47.8% | 25.1% |
| Interquartile 25% (IQ1) | 36.9% | 18.8% |
| Interquartile 75% (IQ3) | 52.3% | 36.2% |
| Interquartile Range (IQR) | 15.4% | 17.4% |
| Standard Deviation (Sample) | 13.4% | 13.5% |
| Standard Deviation (Population) | 13.2% | 13.4% |
Similar Demographics by Associate's Degree
Demographics Similar to Moroccans by Associate's Degree
In terms of associate's degree, the demographic groups most similar to Moroccans are Assyrian/Chaldean/Syriac (48.2%, a difference of 0.020%), European (48.2%, a difference of 0.060%), Immigrants from Albania (48.2%, a difference of 0.10%), Pakistani (48.1%, a difference of 0.24%), and Immigrants from Eritrea (48.1%, a difference of 0.28%).
| Demographics | Rating | Rank | Associate's Degree |
| Immigrants | Uganda | 92.1 /100 | #127 | Exceptional 48.5% |
| Immigrants | Eastern Africa | 91.6 /100 | #128 | Exceptional 48.4% |
| Swedes | 91.5 /100 | #129 | Exceptional 48.4% |
| Immigrants | Jordan | 91.2 /100 | #130 | Exceptional 48.4% |
| Icelanders | 90.8 /100 | #131 | Exceptional 48.3% |
| Immigrants | Albania | 89.9 /100 | #132 | Excellent 48.2% |
| Assyrians/Chaldeans/Syriacs | 89.4 /100 | #133 | Excellent 48.2% |
| Moroccans | 89.3 /100 | #134 | Excellent 48.2% |
| Europeans | 89.0 /100 | #135 | Excellent 48.2% |
| Pakistanis | 88.0 /100 | #136 | Excellent 48.1% |
| Immigrants | Eritrea | 87.8 /100 | #137 | Excellent 48.1% |
| Poles | 87.3 /100 | #138 | Excellent 48.0% |
| Slovenes | 85.1 /100 | #139 | Excellent 47.9% |
| Immigrants | Southern Europe | 84.4 /100 | #140 | Excellent 47.8% |
| Taiwanese | 83.3 /100 | #141 | Excellent 47.7% |
Demographics Similar to Navajo by Associate's Degree
In terms of associate's degree, the demographic groups most similar to Navajo are Inupiat (32.6%, a difference of 0.050%), Yakama (32.3%, a difference of 0.83%), Tohono O'odham (31.8%, a difference of 2.5%), Immigrants from Mexico (33.7%, a difference of 3.5%), and Pueblo (34.0%, a difference of 4.3%).
| Demographics | Rating | Rank | Associate's Degree |
| Mexicans | 0.0 /100 | #333 | Tragic 35.0% |
| Natives/Alaskans | 0.0 /100 | #334 | Tragic 34.9% |
| Spanish American Indians | 0.0 /100 | #335 | Tragic 34.9% |
| Hopi | 0.0 /100 | #336 | Tragic 34.6% |
| Lumbee | 0.0 /100 | #337 | Tragic 34.1% |
| Pueblo | 0.0 /100 | #338 | Tragic 34.0% |
| Immigrants | Mexico | 0.0 /100 | #339 | Tragic 33.7% |
| Navajo | 0.0 /100 | #340 | Tragic 32.6% |
| Inupiat | 0.0 /100 | #341 | Tragic 32.6% |
| Yakama | 0.0 /100 | #342 | Tragic 32.3% |
| Tohono O'odham | 0.0 /100 | #343 | Tragic 31.8% |
| Yuman | 0.0 /100 | #344 | Tragic 31.3% |
| Pima | 0.0 /100 | #345 | Tragic 30.2% |
| Houma | 0.0 /100 | #346 | Tragic 28.2% |
| Yup'ik | 0.0 /100 | #347 | Tragic 25.0% |