Fijian vs Ute 1st Grade
COMPARE
Fijian
Ute
1st Grade
1st Grade Comparison
Fijians
Ute
97.5%
1ST GRADE
0.5/ 100
METRIC RATING
259th/ 347
METRIC RANK
98.2%
1ST GRADE
96.2/ 100
METRIC RATING
114th/ 347
METRIC RANK
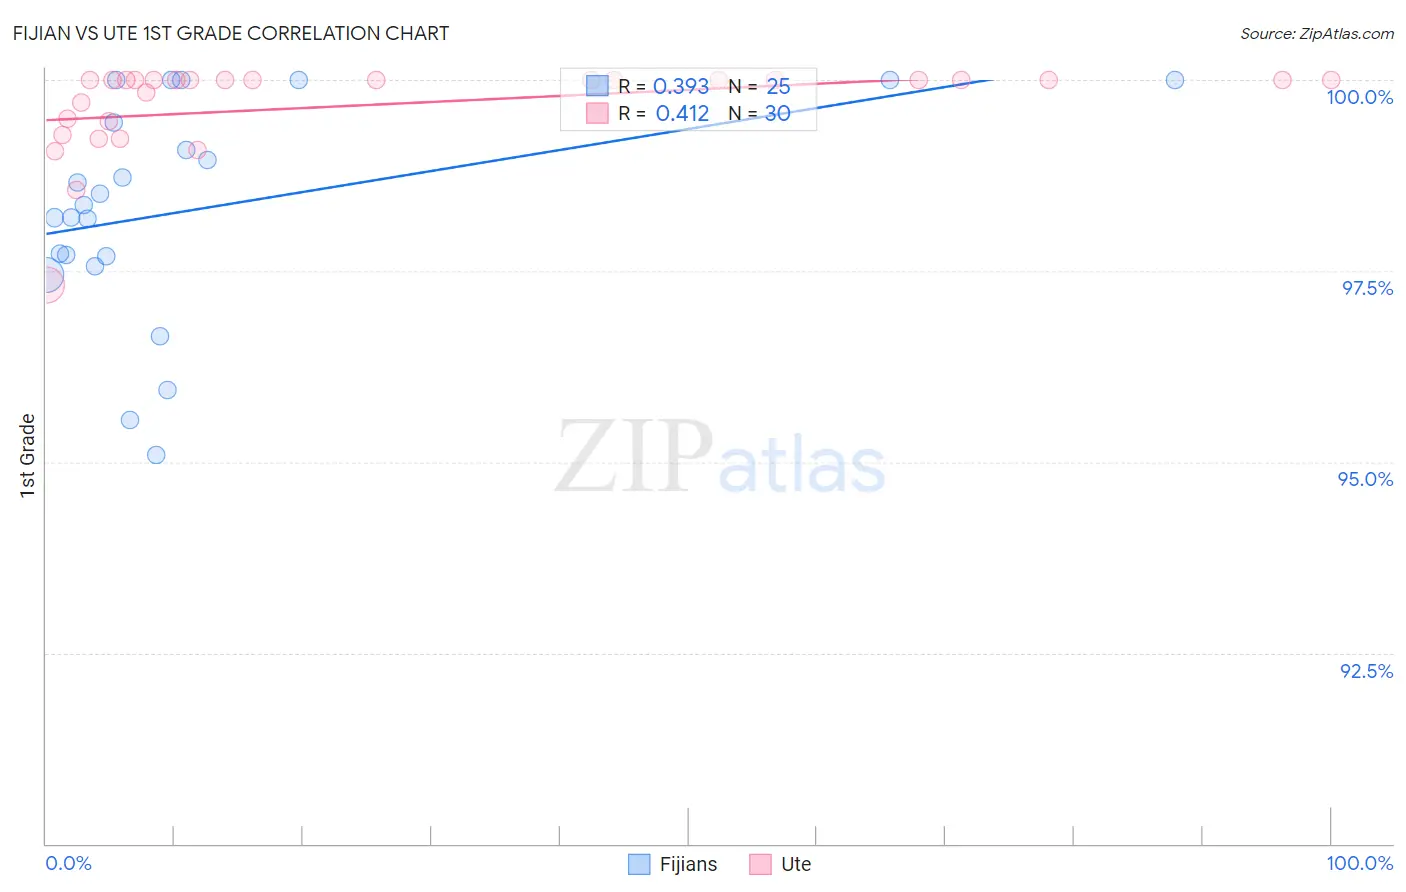
Fijian vs Ute 1st Grade Correlation Chart
The statistical analysis conducted on geographies consisting of 55,948,842 people shows a mild positive correlation between the proportion of Fijians and percentage of population with at least 1st grade education in the United States with a correlation coefficient (R) of 0.393 and weighted average of 97.5%. Similarly, the statistical analysis conducted on geographies consisting of 55,667,712 people shows a moderate positive correlation between the proportion of Ute and percentage of population with at least 1st grade education in the United States with a correlation coefficient (R) of 0.412 and weighted average of 98.2%, a difference of 0.67%.
1st Grade Correlation Summary
| Measurement | Fijian | Ute |
| Minimum | 95.1% | 97.3% |
| Maximum | 100.0% | 100.0% |
| Range | 4.9% | 2.7% |
| Mean | 98.3% | 99.7% |
| Median | 98.4% | 100.0% |
| Interquartile 25% (IQ1) | 97.6% | 99.5% |
| Interquartile 75% (IQ3) | 99.7% | 100.0% |
| Interquartile Range (IQR) | 2.1% | 0.54% |
| Standard Deviation (Sample) | 1.4% | 0.59% |
| Standard Deviation (Population) | 1.4% | 0.58% |
Similar Demographics by 1st Grade
Demographics Similar to Fijians by 1st Grade
In terms of 1st grade, the demographic groups most similar to Fijians are Armenian (97.5%, a difference of 0.0%), Yaqui (97.5%, a difference of 0.010%), Indian (Asian) (97.5%, a difference of 0.010%), Immigrants from Ethiopia (97.5%, a difference of 0.010%), and Assyrian/Chaldean/Syriac (97.5%, a difference of 0.010%).
| Demographics | Rating | Rank | 1st Grade |
| Immigrants | Africa | 0.9 /100 | #252 | Tragic 97.6% |
| Immigrants | Congo | 0.7 /100 | #253 | Tragic 97.5% |
| Immigrants | Asia | 0.7 /100 | #254 | Tragic 97.5% |
| Immigrants | Colombia | 0.6 /100 | #255 | Tragic 97.5% |
| Jamaicans | 0.6 /100 | #256 | Tragic 97.5% |
| Yaqui | 0.6 /100 | #257 | Tragic 97.5% |
| Indians (Asian) | 0.6 /100 | #258 | Tragic 97.5% |
| Fijians | 0.5 /100 | #259 | Tragic 97.5% |
| Armenians | 0.5 /100 | #260 | Tragic 97.5% |
| Immigrants | Ethiopia | 0.4 /100 | #261 | Tragic 97.5% |
| Assyrians/Chaldeans/Syriacs | 0.4 /100 | #262 | Tragic 97.5% |
| Immigrants | South America | 0.4 /100 | #263 | Tragic 97.5% |
| Taiwanese | 0.4 /100 | #264 | Tragic 97.5% |
| Cubans | 0.3 /100 | #265 | Tragic 97.5% |
| Immigrants | Liberia | 0.3 /100 | #266 | Tragic 97.5% |
Demographics Similar to Ute by 1st Grade
In terms of 1st grade, the demographic groups most similar to Ute are Immigrants from Latvia (98.2%, a difference of 0.0%), Iranian (98.2%, a difference of 0.0%), Immigrants from Singapore (98.2%, a difference of 0.010%), Immigrants from Czechoslovakia (98.2%, a difference of 0.010%), and Immigrants from Norway (98.2%, a difference of 0.010%).
| Demographics | Rating | Rank | 1st Grade |
| Immigrants | Switzerland | 97.3 /100 | #107 | Exceptional 98.2% |
| Bhutanese | 97.3 /100 | #108 | Exceptional 98.2% |
| German Russians | 97.1 /100 | #109 | Exceptional 98.2% |
| Immigrants | Singapore | 96.7 /100 | #110 | Exceptional 98.2% |
| Immigrants | Czechoslovakia | 96.6 /100 | #111 | Exceptional 98.2% |
| Immigrants | Norway | 96.6 /100 | #112 | Exceptional 98.2% |
| Immigrants | Latvia | 96.4 /100 | #113 | Exceptional 98.2% |
| Ute | 96.2 /100 | #114 | Exceptional 98.2% |
| Iranians | 96.0 /100 | #115 | Exceptional 98.2% |
| Spanish | 95.9 /100 | #116 | Exceptional 98.2% |
| Yugoslavians | 95.5 /100 | #117 | Exceptional 98.2% |
| Immigrants | France | 95.5 /100 | #118 | Exceptional 98.2% |
| Thais | 94.7 /100 | #119 | Exceptional 98.1% |
| Okinawans | 94.5 /100 | #120 | Exceptional 98.1% |
| Immigrants | Zimbabwe | 94.0 /100 | #121 | Exceptional 98.1% |