Syrian vs Immigrants from Bulgaria High School Diploma
COMPARE
Syrian
Immigrants from Bulgaria
High School Diploma
High School Diploma Comparison
Syrians
Immigrants from Bulgaria
90.3%
HIGH SCHOOL DIPLOMA
97.0/ 100
METRIC RATING
106th/ 347
METRIC RANK
90.6%
HIGH SCHOOL DIPLOMA
98.9/ 100
METRIC RATING
86th/ 347
METRIC RANK
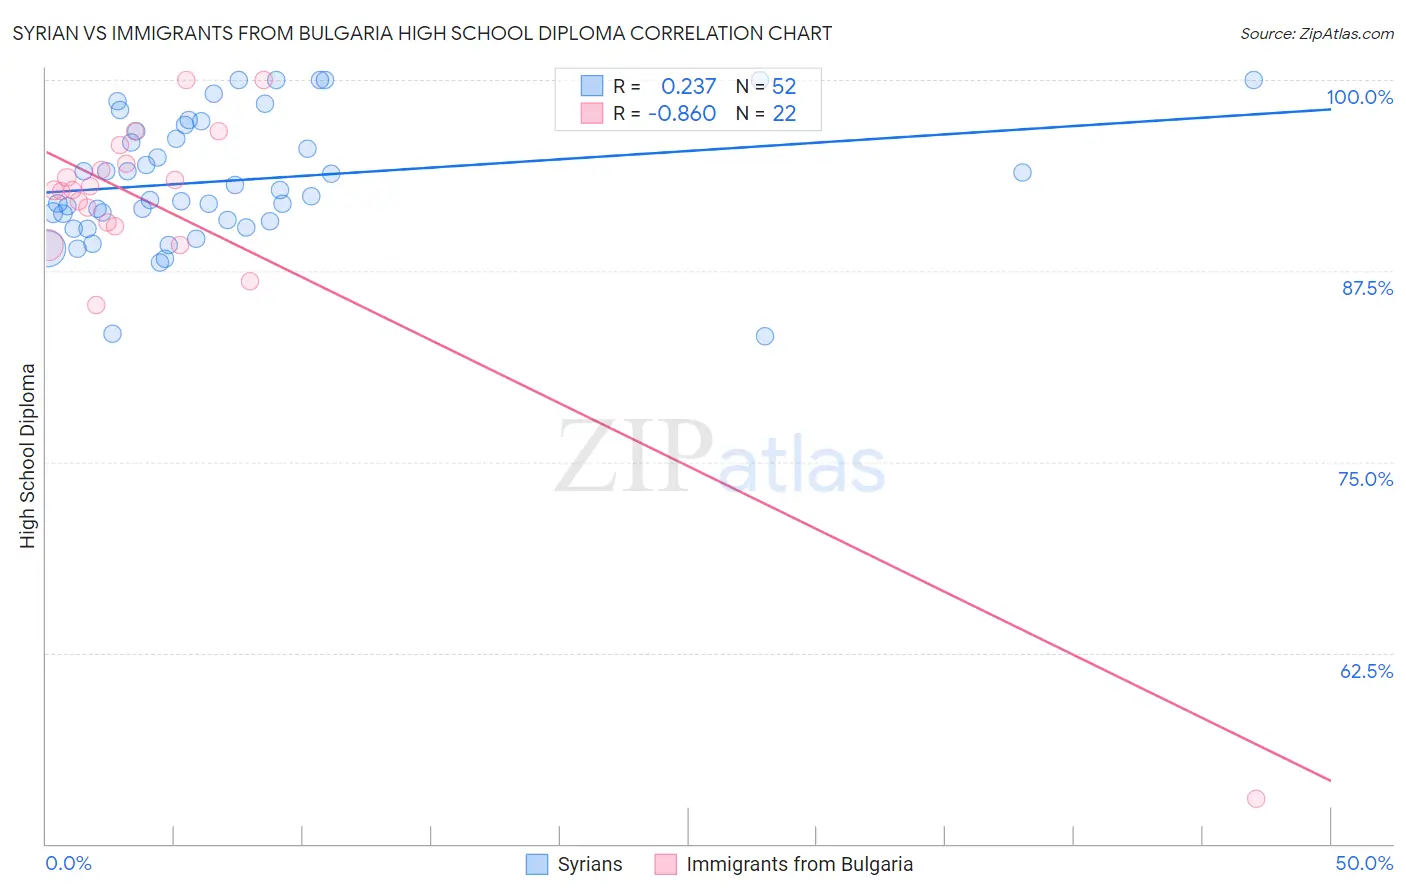
Syrian vs Immigrants from Bulgaria High School Diploma Correlation Chart
The statistical analysis conducted on geographies consisting of 266,306,452 people shows a weak positive correlation between the proportion of Syrians and percentage of population with at least high school diploma education in the United States with a correlation coefficient (R) of 0.237 and weighted average of 90.3%. Similarly, the statistical analysis conducted on geographies consisting of 172,552,181 people shows a very strong negative correlation between the proportion of Immigrants from Bulgaria and percentage of population with at least high school diploma education in the United States with a correlation coefficient (R) of -0.860 and weighted average of 90.6%, a difference of 0.37%.
High School Diploma Correlation Summary
| Measurement | Syrian | Immigrants from Bulgaria |
| Minimum | 83.2% | 52.9% |
| Maximum | 100.0% | 100.0% |
| Range | 16.8% | 47.1% |
| Mean | 93.4% | 91.1% |
| Median | 92.6% | 92.8% |
| Interquartile 25% (IQ1) | 90.8% | 90.5% |
| Interquartile 75% (IQ3) | 96.9% | 94.6% |
| Interquartile Range (IQR) | 6.1% | 4.1% |
| Standard Deviation (Sample) | 4.1% | 9.3% |
| Standard Deviation (Population) | 4.1% | 9.1% |
Demographics Similar to Syrians and Immigrants from Bulgaria by High School Diploma
In terms of high school diploma, the demographic groups most similar to Syrians are Lebanese (90.4%, a difference of 0.050%), Immigrants from Croatia (90.4%, a difference of 0.11%), Immigrants from Romania (90.4%, a difference of 0.12%), Aleut (90.4%, a difference of 0.15%), and Immigrants from Norway (90.5%, a difference of 0.16%). Similarly, the demographic groups most similar to Immigrants from Bulgaria are Immigrants from Turkey (90.6%, a difference of 0.0%), Immigrants from France (90.6%, a difference of 0.020%), Canadian (90.6%, a difference of 0.040%), Celtic (90.6%, a difference of 0.050%), and South African (90.6%, a difference of 0.070%).
| Demographics | Rating | Rank | High School Diploma |
| Immigrants | Bulgaria | 98.9 /100 | #86 | Exceptional 90.6% |
| Immigrants | Turkey | 98.9 /100 | #87 | Exceptional 90.6% |
| Immigrants | France | 98.8 /100 | #88 | Exceptional 90.6% |
| Canadians | 98.7 /100 | #89 | Exceptional 90.6% |
| Celtics | 98.7 /100 | #90 | Exceptional 90.6% |
| South Africans | 98.6 /100 | #91 | Exceptional 90.6% |
| Swiss | 98.6 /100 | #92 | Exceptional 90.6% |
| Immigrants | Western Europe | 98.6 /100 | #93 | Exceptional 90.6% |
| Immigrants | Israel | 98.5 /100 | #94 | Exceptional 90.5% |
| Icelanders | 98.5 /100 | #95 | Exceptional 90.5% |
| Immigrants | Serbia | 98.4 /100 | #96 | Exceptional 90.5% |
| Immigrants | Kuwait | 98.3 /100 | #97 | Exceptional 90.5% |
| Immigrants | Korea | 98.3 /100 | #98 | Exceptional 90.5% |
| Immigrants | Europe | 98.2 /100 | #99 | Exceptional 90.5% |
| Immigrants | North Macedonia | 98.1 /100 | #100 | Exceptional 90.5% |
| Immigrants | Norway | 98.0 /100 | #101 | Exceptional 90.5% |
| Aleuts | 98.0 /100 | #102 | Exceptional 90.4% |
| Immigrants | Romania | 97.8 /100 | #103 | Exceptional 90.4% |
| Immigrants | Croatia | 97.8 /100 | #104 | Exceptional 90.4% |
| Lebanese | 97.4 /100 | #105 | Exceptional 90.4% |
| Syrians | 97.0 /100 | #106 | Exceptional 90.3% |