Egyptian vs Peruvian 6th Grade
COMPARE
Egyptian
Peruvian
6th Grade
6th Grade Comparison
Egyptians
Peruvians
97.1%
6TH GRADE
50.9/ 100
METRIC RATING
172nd/ 347
METRIC RANK
96.4%
6TH GRADE
0.4/ 100
METRIC RATING
260th/ 347
METRIC RANK
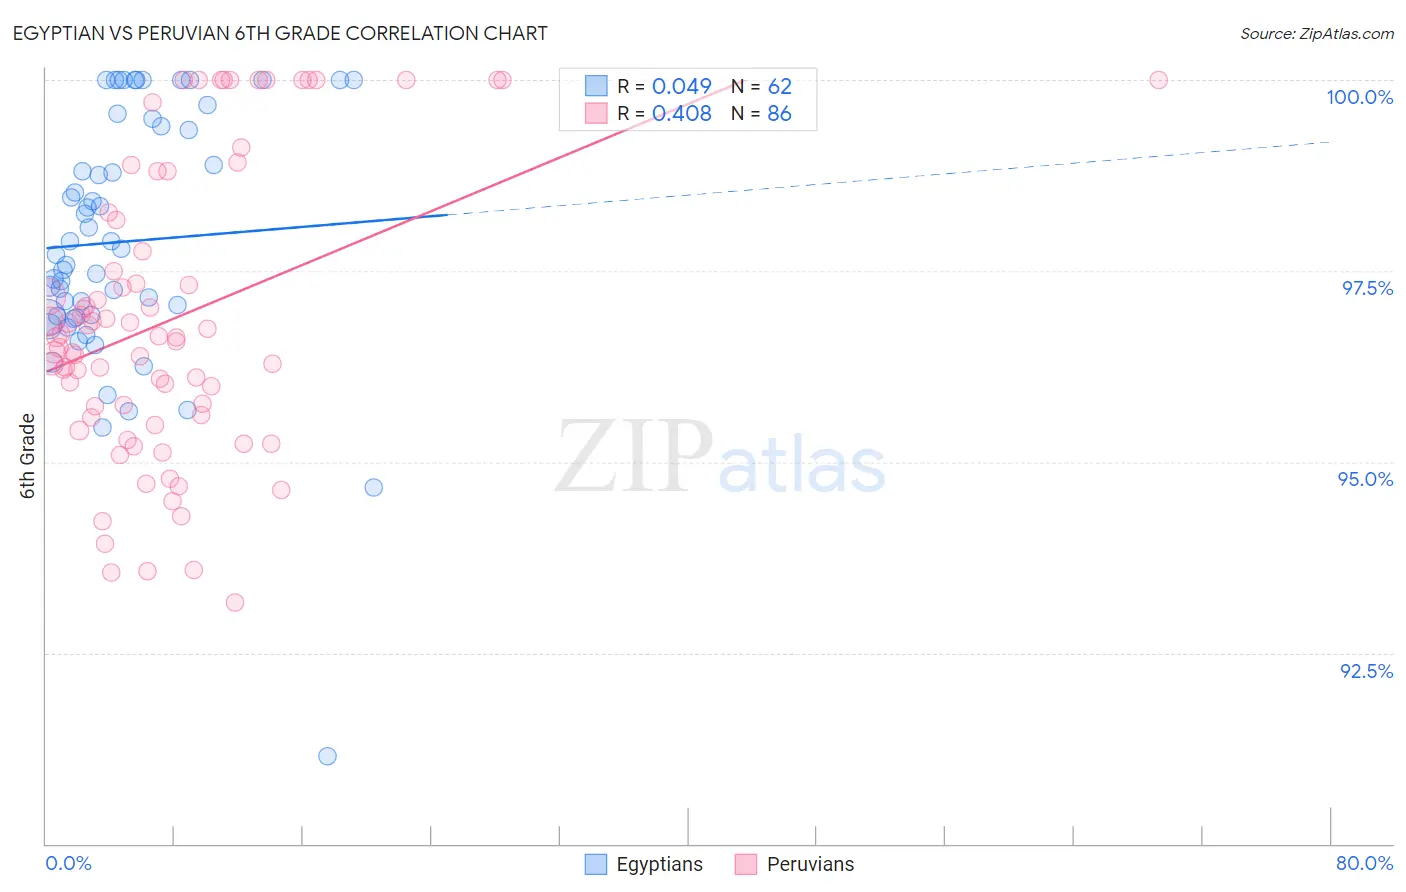
Egyptian vs Peruvian 6th Grade Correlation Chart
The statistical analysis conducted on geographies consisting of 276,927,423 people shows no correlation between the proportion of Egyptians and percentage of population with at least 6th grade education in the United States with a correlation coefficient (R) of 0.049 and weighted average of 97.1%. Similarly, the statistical analysis conducted on geographies consisting of 363,068,462 people shows a moderate positive correlation between the proportion of Peruvians and percentage of population with at least 6th grade education in the United States with a correlation coefficient (R) of 0.408 and weighted average of 96.4%, a difference of 0.63%.
6th Grade Correlation Summary
| Measurement | Egyptian | Peruvian |
| Minimum | 91.1% | 93.2% |
| Maximum | 100.0% | 100.0% |
| Range | 8.9% | 6.8% |
| Mean | 97.9% | 96.9% |
| Median | 97.8% | 96.6% |
| Interquartile 25% (IQ1) | 96.9% | 95.6% |
| Interquartile 75% (IQ3) | 99.4% | 98.2% |
| Interquartile Range (IQR) | 2.5% | 2.6% |
| Standard Deviation (Sample) | 1.7% | 1.9% |
| Standard Deviation (Population) | 1.7% | 1.9% |
Similar Demographics by 6th Grade
Demographics Similar to Egyptians by 6th Grade
In terms of 6th grade, the demographic groups most similar to Egyptians are Immigrants from Sri Lanka (97.1%, a difference of 0.0%), Arab (97.0%, a difference of 0.0%), Venezuelan (97.0%, a difference of 0.0%), Immigrants from Italy (97.1%, a difference of 0.010%), and Apache (97.1%, a difference of 0.010%).
| Demographics | Rating | Rank | 6th Grade |
| Immigrants | Poland | 56.2 /100 | #165 | Average 97.1% |
| Immigrants | Italy | 53.8 /100 | #166 | Average 97.1% |
| Apache | 53.6 /100 | #167 | Average 97.1% |
| Immigrants | Taiwan | 53.5 /100 | #168 | Average 97.1% |
| Bermudans | 52.6 /100 | #169 | Average 97.1% |
| Chileans | 52.1 /100 | #170 | Average 97.1% |
| Immigrants | Sri Lanka | 51.7 /100 | #171 | Average 97.1% |
| Egyptians | 50.9 /100 | #172 | Average 97.1% |
| Arabs | 50.1 /100 | #173 | Average 97.0% |
| Venezuelans | 50.0 /100 | #174 | Average 97.0% |
| Immigrants | Kazakhstan | 47.3 /100 | #175 | Average 97.0% |
| Immigrants | Micronesia | 47.1 /100 | #176 | Average 97.0% |
| Mongolians | 46.7 /100 | #177 | Average 97.0% |
| Pakistanis | 46.0 /100 | #178 | Average 97.0% |
| Immigrants | Kenya | 45.3 /100 | #179 | Average 97.0% |
Demographics Similar to Peruvians by 6th Grade
In terms of 6th grade, the demographic groups most similar to Peruvians are South American (96.4%, a difference of 0.0%), Immigrants from China (96.4%, a difference of 0.010%), Immigrants from Sierra Leone (96.4%, a difference of 0.010%), Taiwanese (96.5%, a difference of 0.020%), and U.S. Virgin Islander (96.5%, a difference of 0.030%).
| Demographics | Rating | Rank | 6th Grade |
| Jamaicans | 0.6 /100 | #253 | Tragic 96.5% |
| Immigrants | Ethiopia | 0.6 /100 | #254 | Tragic 96.5% |
| Immigrants | Congo | 0.6 /100 | #255 | Tragic 96.5% |
| U.S. Virgin Islanders | 0.5 /100 | #256 | Tragic 96.5% |
| Taiwanese | 0.5 /100 | #257 | Tragic 96.5% |
| Immigrants | China | 0.4 /100 | #258 | Tragic 96.4% |
| South Americans | 0.4 /100 | #259 | Tragic 96.4% |
| Peruvians | 0.4 /100 | #260 | Tragic 96.4% |
| Immigrants | Sierra Leone | 0.4 /100 | #261 | Tragic 96.4% |
| Immigrants | Nigeria | 0.3 /100 | #262 | Tragic 96.4% |
| Immigrants | Colombia | 0.3 /100 | #263 | Tragic 96.4% |
| Armenians | 0.3 /100 | #264 | Tragic 96.4% |
| Immigrants | Jamaica | 0.2 /100 | #265 | Tragic 96.4% |
| Ghanaians | 0.2 /100 | #266 | Tragic 96.4% |
| Afghans | 0.2 /100 | #267 | Tragic 96.4% |