Immigrants from Nepal vs Peruvian 6th Grade
COMPARE
Immigrants from Nepal
Peruvian
6th Grade
6th Grade Comparison
Immigrants from Nepal
Peruvians
96.8%
6TH GRADE
10.1/ 100
METRIC RATING
210th/ 347
METRIC RANK
96.4%
6TH GRADE
0.4/ 100
METRIC RATING
260th/ 347
METRIC RANK
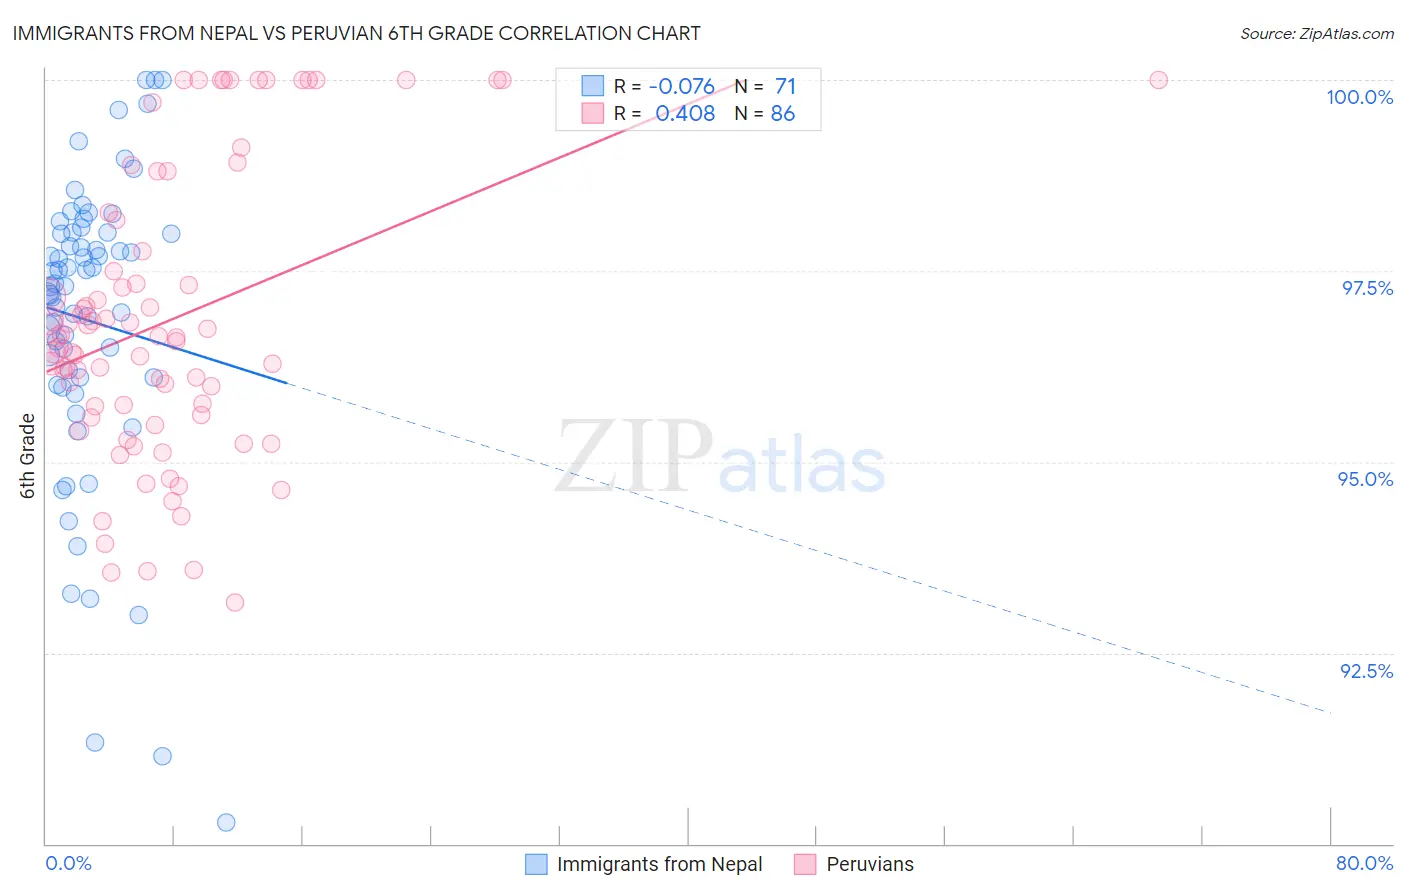
Immigrants from Nepal vs Peruvian 6th Grade Correlation Chart
The statistical analysis conducted on geographies consisting of 186,739,570 people shows a slight negative correlation between the proportion of Immigrants from Nepal and percentage of population with at least 6th grade education in the United States with a correlation coefficient (R) of -0.076 and weighted average of 96.8%. Similarly, the statistical analysis conducted on geographies consisting of 363,068,462 people shows a moderate positive correlation between the proportion of Peruvians and percentage of population with at least 6th grade education in the United States with a correlation coefficient (R) of 0.408 and weighted average of 96.4%, a difference of 0.38%.
6th Grade Correlation Summary
| Measurement | Immigrants from Nepal | Peruvian |
| Minimum | 90.3% | 93.2% |
| Maximum | 100.0% | 100.0% |
| Range | 9.7% | 6.8% |
| Mean | 96.8% | 96.9% |
| Median | 97.3% | 96.6% |
| Interquartile 25% (IQ1) | 96.1% | 95.6% |
| Interquartile 75% (IQ3) | 98.0% | 98.2% |
| Interquartile Range (IQR) | 1.9% | 2.6% |
| Standard Deviation (Sample) | 2.0% | 1.9% |
| Standard Deviation (Population) | 2.0% | 1.9% |
Similar Demographics by 6th Grade
Demographics Similar to Immigrants from Nepal by 6th Grade
In terms of 6th grade, the demographic groups most similar to Immigrants from Nepal are Samoan (96.8%, a difference of 0.010%), Immigrants from Oceania (96.8%, a difference of 0.010%), Immigrants from Iraq (96.8%, a difference of 0.010%), Laotian (96.8%, a difference of 0.020%), and Iraqi (96.8%, a difference of 0.020%).
| Demographics | Rating | Rank | 6th Grade |
| Sudanese | 13.9 /100 | #203 | Poor 96.8% |
| Immigrants | Bahamas | 13.8 /100 | #204 | Poor 96.8% |
| Natives/Alaskans | 13.0 /100 | #205 | Poor 96.8% |
| Laotians | 11.8 /100 | #206 | Poor 96.8% |
| Iraqis | 11.7 /100 | #207 | Poor 96.8% |
| Samoans | 11.0 /100 | #208 | Poor 96.8% |
| Immigrants | Oceania | 11.0 /100 | #209 | Poor 96.8% |
| Immigrants | Nepal | 10.1 /100 | #210 | Poor 96.8% |
| Immigrants | Iraq | 9.2 /100 | #211 | Tragic 96.8% |
| Moroccans | 9.0 /100 | #212 | Tragic 96.8% |
| Immigrants | Sudan | 8.7 /100 | #213 | Tragic 96.8% |
| Portuguese | 8.2 /100 | #214 | Tragic 96.8% |
| Sierra Leoneans | 8.0 /100 | #215 | Tragic 96.8% |
| Paiute | 7.8 /100 | #216 | Tragic 96.8% |
| Liberians | 7.5 /100 | #217 | Tragic 96.8% |
Demographics Similar to Peruvians by 6th Grade
In terms of 6th grade, the demographic groups most similar to Peruvians are South American (96.4%, a difference of 0.0%), Immigrants from China (96.4%, a difference of 0.010%), Immigrants from Sierra Leone (96.4%, a difference of 0.010%), Taiwanese (96.5%, a difference of 0.020%), and U.S. Virgin Islander (96.5%, a difference of 0.030%).
| Demographics | Rating | Rank | 6th Grade |
| Jamaicans | 0.6 /100 | #253 | Tragic 96.5% |
| Immigrants | Ethiopia | 0.6 /100 | #254 | Tragic 96.5% |
| Immigrants | Congo | 0.6 /100 | #255 | Tragic 96.5% |
| U.S. Virgin Islanders | 0.5 /100 | #256 | Tragic 96.5% |
| Taiwanese | 0.5 /100 | #257 | Tragic 96.5% |
| Immigrants | China | 0.4 /100 | #258 | Tragic 96.4% |
| South Americans | 0.4 /100 | #259 | Tragic 96.4% |
| Peruvians | 0.4 /100 | #260 | Tragic 96.4% |
| Immigrants | Sierra Leone | 0.4 /100 | #261 | Tragic 96.4% |
| Immigrants | Nigeria | 0.3 /100 | #262 | Tragic 96.4% |
| Immigrants | Colombia | 0.3 /100 | #263 | Tragic 96.4% |
| Armenians | 0.3 /100 | #264 | Tragic 96.4% |
| Immigrants | Jamaica | 0.2 /100 | #265 | Tragic 96.4% |
| Ghanaians | 0.2 /100 | #266 | Tragic 96.4% |
| Afghans | 0.2 /100 | #267 | Tragic 96.4% |