Egyptian vs Yup'ik 6th Grade
COMPARE
Egyptian
Yup'ik
6th Grade
6th Grade Comparison
Egyptians
Yup'ik
97.1%
6TH GRADE
50.9/ 100
METRIC RATING
172nd/ 347
METRIC RANK
98.0%
6TH GRADE
100.0/ 100
METRIC RATING
27th/ 347
METRIC RANK
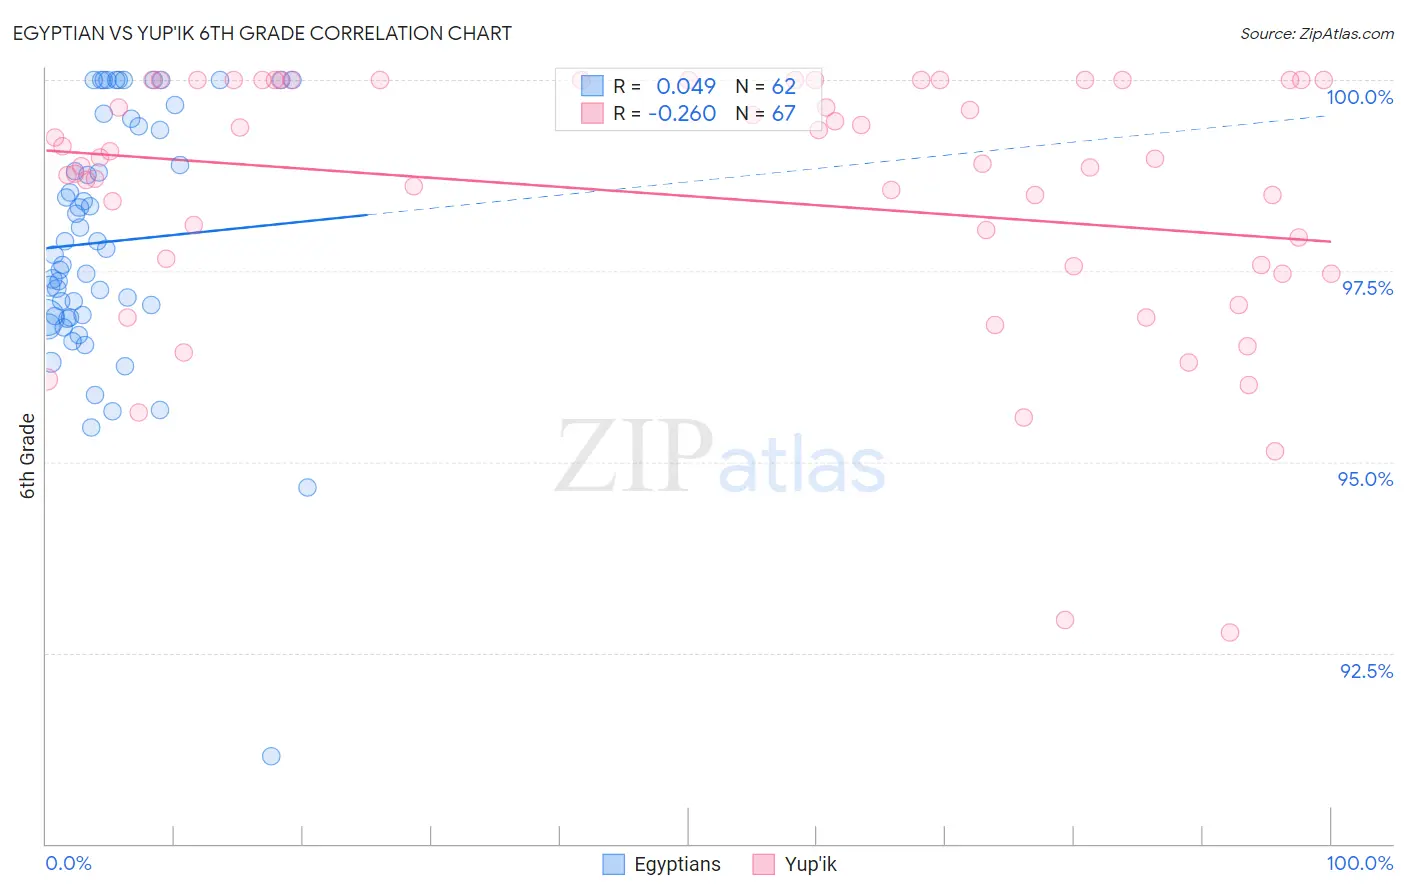
Egyptian vs Yup'ik 6th Grade Correlation Chart
The statistical analysis conducted on geographies consisting of 276,927,423 people shows no correlation between the proportion of Egyptians and percentage of population with at least 6th grade education in the United States with a correlation coefficient (R) of 0.049 and weighted average of 97.1%. Similarly, the statistical analysis conducted on geographies consisting of 39,963,824 people shows a weak negative correlation between the proportion of Yup'ik and percentage of population with at least 6th grade education in the United States with a correlation coefficient (R) of -0.260 and weighted average of 98.0%, a difference of 0.98%.
6th Grade Correlation Summary
| Measurement | Egyptian | Yup'ik |
| Minimum | 91.1% | 92.8% |
| Maximum | 100.0% | 100.0% |
| Range | 8.9% | 7.2% |
| Mean | 97.9% | 98.5% |
| Median | 97.8% | 98.9% |
| Interquartile 25% (IQ1) | 96.9% | 97.6% |
| Interquartile 75% (IQ3) | 99.4% | 100.0% |
| Interquartile Range (IQR) | 2.5% | 2.4% |
| Standard Deviation (Sample) | 1.7% | 1.7% |
| Standard Deviation (Population) | 1.7% | 1.7% |
Similar Demographics by 6th Grade
Demographics Similar to Egyptians by 6th Grade
In terms of 6th grade, the demographic groups most similar to Egyptians are Immigrants from Sri Lanka (97.1%, a difference of 0.0%), Arab (97.0%, a difference of 0.0%), Venezuelan (97.0%, a difference of 0.0%), Immigrants from Italy (97.1%, a difference of 0.010%), and Apache (97.1%, a difference of 0.010%).
| Demographics | Rating | Rank | 6th Grade |
| Immigrants | Poland | 56.2 /100 | #165 | Average 97.1% |
| Immigrants | Italy | 53.8 /100 | #166 | Average 97.1% |
| Apache | 53.6 /100 | #167 | Average 97.1% |
| Immigrants | Taiwan | 53.5 /100 | #168 | Average 97.1% |
| Bermudans | 52.6 /100 | #169 | Average 97.1% |
| Chileans | 52.1 /100 | #170 | Average 97.1% |
| Immigrants | Sri Lanka | 51.7 /100 | #171 | Average 97.1% |
| Egyptians | 50.9 /100 | #172 | Average 97.1% |
| Arabs | 50.1 /100 | #173 | Average 97.0% |
| Venezuelans | 50.0 /100 | #174 | Average 97.0% |
| Immigrants | Kazakhstan | 47.3 /100 | #175 | Average 97.0% |
| Immigrants | Micronesia | 47.1 /100 | #176 | Average 97.0% |
| Mongolians | 46.7 /100 | #177 | Average 97.0% |
| Pakistanis | 46.0 /100 | #178 | Average 97.0% |
| Immigrants | Kenya | 45.3 /100 | #179 | Average 97.0% |
Demographics Similar to Yup'ik by 6th Grade
In terms of 6th grade, the demographic groups most similar to Yup'ik are Czech (98.0%, a difference of 0.0%), Scandinavian (98.0%, a difference of 0.0%), French (98.0%, a difference of 0.0%), French Canadian (98.0%, a difference of 0.010%), and Scotch-Irish (98.0%, a difference of 0.020%).
| Demographics | Rating | Rank | 6th Grade |
| Finns | 100.0 /100 | #20 | Exceptional 98.1% |
| Lithuanians | 100.0 /100 | #21 | Exceptional 98.1% |
| Danes | 100.0 /100 | #22 | Exceptional 98.0% |
| Sioux | 100.0 /100 | #23 | Exceptional 98.0% |
| Croatians | 100.0 /100 | #24 | Exceptional 98.0% |
| Scotch-Irish | 100.0 /100 | #25 | Exceptional 98.0% |
| Czechs | 100.0 /100 | #26 | Exceptional 98.0% |
| Yup'ik | 100.0 /100 | #27 | Exceptional 98.0% |
| Scandinavians | 100.0 /100 | #28 | Exceptional 98.0% |
| French | 100.0 /100 | #29 | Exceptional 98.0% |
| French Canadians | 100.0 /100 | #30 | Exceptional 98.0% |
| Europeans | 100.0 /100 | #31 | Exceptional 98.0% |
| Alaska Natives | 100.0 /100 | #32 | Exceptional 98.0% |
| Chippewa | 100.0 /100 | #33 | Exceptional 97.9% |
| Swiss | 100.0 /100 | #34 | Exceptional 97.9% |