Egyptian vs Immigrants from Australia 3rd Grade
COMPARE
Egyptian
Immigrants from Australia
3rd Grade
3rd Grade Comparison
Egyptians
Immigrants from Australia
97.7%
3RD GRADE
46.6/ 100
METRIC RATING
177th/ 347
METRIC RANK
98.1%
3RD GRADE
98.9/ 100
METRIC RATING
85th/ 347
METRIC RANK
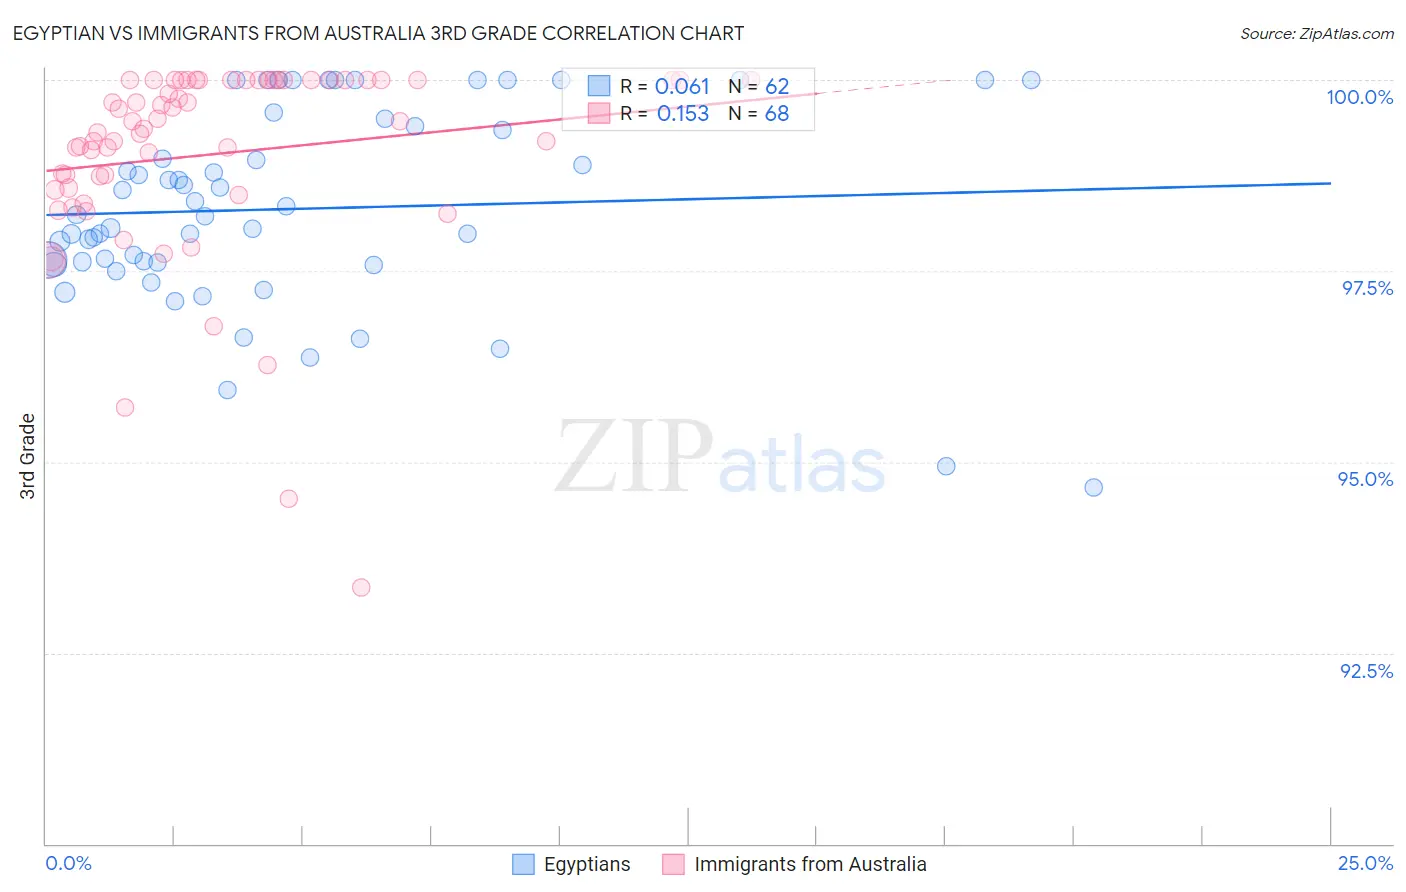
Egyptian vs Immigrants from Australia 3rd Grade Correlation Chart
The statistical analysis conducted on geographies consisting of 276,927,423 people shows a slight positive correlation between the proportion of Egyptians and percentage of population with at least 3rd grade education in the United States with a correlation coefficient (R) of 0.061 and weighted average of 97.7%. Similarly, the statistical analysis conducted on geographies consisting of 227,203,469 people shows a poor positive correlation between the proportion of Immigrants from Australia and percentage of population with at least 3rd grade education in the United States with a correlation coefficient (R) of 0.153 and weighted average of 98.1%, a difference of 0.39%.
3rd Grade Correlation Summary
| Measurement | Egyptian | Immigrants from Australia |
| Minimum | 94.7% | 93.4% |
| Maximum | 100.0% | 100.0% |
| Range | 5.3% | 6.6% |
| Mean | 98.3% | 99.0% |
| Median | 98.2% | 99.4% |
| Interquartile 25% (IQ1) | 97.6% | 98.6% |
| Interquartile 75% (IQ3) | 99.4% | 100.0% |
| Interquartile Range (IQR) | 1.8% | 1.4% |
| Standard Deviation (Sample) | 1.3% | 1.3% |
| Standard Deviation (Population) | 1.3% | 1.3% |
Similar Demographics by 3rd Grade
Demographics Similar to Egyptians by 3rd Grade
In terms of 3rd grade, the demographic groups most similar to Egyptians are Immigrants from Micronesia (97.8%, a difference of 0.0%), Immigrants from Poland (97.8%, a difference of 0.0%), Immigrants from Brazil (97.7%, a difference of 0.0%), Immigrants from Belarus (97.7%, a difference of 0.0%), and Immigrants from Korea (97.8%, a difference of 0.010%).
| Demographics | Rating | Rank | 3rd Grade |
| Brazilians | 53.7 /100 | #170 | Average 97.8% |
| Kenyans | 51.8 /100 | #171 | Average 97.8% |
| Spanish Americans | 51.8 /100 | #172 | Average 97.8% |
| Immigrants | Korea | 50.9 /100 | #173 | Average 97.8% |
| Navajo | 50.0 /100 | #174 | Average 97.8% |
| Immigrants | Micronesia | 47.6 /100 | #175 | Average 97.8% |
| Immigrants | Poland | 47.1 /100 | #176 | Average 97.8% |
| Egyptians | 46.6 /100 | #177 | Average 97.7% |
| Immigrants | Brazil | 46.4 /100 | #178 | Average 97.7% |
| Immigrants | Belarus | 45.9 /100 | #179 | Average 97.7% |
| Immigrants | Sri Lanka | 45.1 /100 | #180 | Average 97.7% |
| Immigrants | Venezuela | 44.4 /100 | #181 | Average 97.7% |
| Argentineans | 42.9 /100 | #182 | Average 97.7% |
| Arabs | 40.0 /100 | #183 | Fair 97.7% |
| Immigrants | Kazakhstan | 37.4 /100 | #184 | Fair 97.7% |
Demographics Similar to Immigrants from Australia by 3rd Grade
In terms of 3rd grade, the demographic groups most similar to Immigrants from Australia are Immigrants from Sweden (98.1%, a difference of 0.0%), Potawatomi (98.1%, a difference of 0.0%), Immigrants from Denmark (98.1%, a difference of 0.0%), Immigrants from India (98.1%, a difference of 0.0%), and Delaware (98.1%, a difference of 0.0%).
| Demographics | Rating | Rank | 3rd Grade |
| Osage | 99.2 /100 | #78 | Exceptional 98.2% |
| Immigrants | Belgium | 99.1 /100 | #79 | Exceptional 98.1% |
| Macedonians | 99.1 /100 | #80 | Exceptional 98.1% |
| Icelanders | 99.1 /100 | #81 | Exceptional 98.1% |
| Shoshone | 99.0 /100 | #82 | Exceptional 98.1% |
| Ukrainians | 98.9 /100 | #83 | Exceptional 98.1% |
| Immigrants | Sweden | 98.9 /100 | #84 | Exceptional 98.1% |
| Immigrants | Australia | 98.9 /100 | #85 | Exceptional 98.1% |
| Potawatomi | 98.9 /100 | #86 | Exceptional 98.1% |
| Immigrants | Denmark | 98.8 /100 | #87 | Exceptional 98.1% |
| Immigrants | India | 98.8 /100 | #88 | Exceptional 98.1% |
| Delaware | 98.8 /100 | #89 | Exceptional 98.1% |
| Zimbabweans | 98.8 /100 | #90 | Exceptional 98.1% |
| Hopi | 98.7 /100 | #91 | Exceptional 98.1% |
| Immigrants | South Africa | 98.7 /100 | #92 | Exceptional 98.1% |