Immigrants from Barbados vs Immigrants from Australia 3rd Grade
COMPARE
Immigrants from Barbados
Immigrants from Australia
3rd Grade
3rd Grade Comparison
Immigrants from Barbados
Immigrants from Australia
97.1%
3RD GRADE
0.0/ 100
METRIC RATING
286th/ 347
METRIC RANK
98.1%
3RD GRADE
98.9/ 100
METRIC RATING
85th/ 347
METRIC RANK
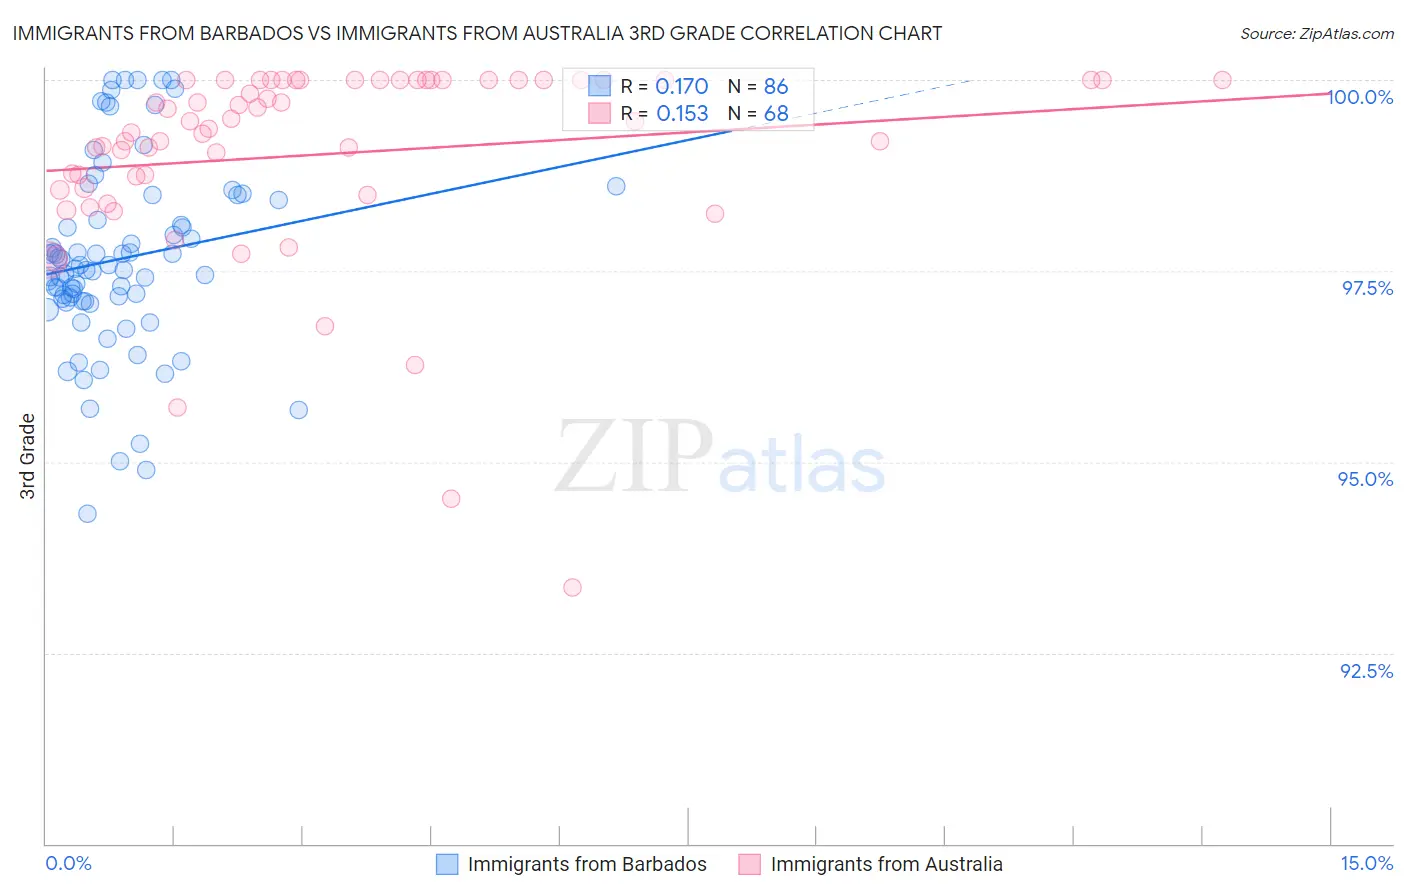
Immigrants from Barbados vs Immigrants from Australia 3rd Grade Correlation Chart
The statistical analysis conducted on geographies consisting of 112,787,503 people shows a poor positive correlation between the proportion of Immigrants from Barbados and percentage of population with at least 3rd grade education in the United States with a correlation coefficient (R) of 0.170 and weighted average of 97.1%. Similarly, the statistical analysis conducted on geographies consisting of 227,203,469 people shows a poor positive correlation between the proportion of Immigrants from Australia and percentage of population with at least 3rd grade education in the United States with a correlation coefficient (R) of 0.153 and weighted average of 98.1%, a difference of 1.1%.
3rd Grade Correlation Summary
| Measurement | Immigrants from Barbados | Immigrants from Australia |
| Minimum | 94.3% | 93.4% |
| Maximum | 100.0% | 100.0% |
| Range | 5.7% | 6.6% |
| Mean | 97.7% | 99.0% |
| Median | 97.5% | 99.4% |
| Interquartile 25% (IQ1) | 97.1% | 98.6% |
| Interquartile 75% (IQ3) | 98.4% | 100.0% |
| Interquartile Range (IQR) | 1.3% | 1.4% |
| Standard Deviation (Sample) | 1.2% | 1.3% |
| Standard Deviation (Population) | 1.2% | 1.3% |
Similar Demographics by 3rd Grade
Demographics Similar to Immigrants from Barbados by 3rd Grade
In terms of 3rd grade, the demographic groups most similar to Immigrants from Barbados are Immigrants from Hong Kong (97.1%, a difference of 0.010%), Immigrants from St. Vincent and the Grenadines (97.1%, a difference of 0.010%), Immigrants from West Indies (97.1%, a difference of 0.010%), Immigrants from Thailand (97.1%, a difference of 0.020%), and Immigrants from Trinidad and Tobago (97.1%, a difference of 0.030%).
| Demographics | Rating | Rank | 3rd Grade |
| Immigrants | Philippines | 0.1 /100 | #279 | Tragic 97.2% |
| Immigrants | Ghana | 0.1 /100 | #280 | Tragic 97.2% |
| Barbadians | 0.1 /100 | #281 | Tragic 97.2% |
| Afghans | 0.1 /100 | #282 | Tragic 97.1% |
| Houma | 0.1 /100 | #283 | Tragic 97.1% |
| Immigrants | Trinidad and Tobago | 0.0 /100 | #284 | Tragic 97.1% |
| Immigrants | Hong Kong | 0.0 /100 | #285 | Tragic 97.1% |
| Immigrants | Barbados | 0.0 /100 | #286 | Tragic 97.1% |
| Immigrants | St. Vincent and the Grenadines | 0.0 /100 | #287 | Tragic 97.1% |
| Immigrants | West Indies | 0.0 /100 | #288 | Tragic 97.1% |
| Immigrants | Thailand | 0.0 /100 | #289 | Tragic 97.1% |
| Immigrants | Portugal | 0.0 /100 | #290 | Tragic 97.0% |
| Immigrants | Afghanistan | 0.0 /100 | #291 | Tragic 97.0% |
| British West Indians | 0.0 /100 | #292 | Tragic 97.0% |
| Immigrants | Grenada | 0.0 /100 | #293 | Tragic 97.0% |
Demographics Similar to Immigrants from Australia by 3rd Grade
In terms of 3rd grade, the demographic groups most similar to Immigrants from Australia are Immigrants from Sweden (98.1%, a difference of 0.0%), Potawatomi (98.1%, a difference of 0.0%), Immigrants from Denmark (98.1%, a difference of 0.0%), Immigrants from India (98.1%, a difference of 0.0%), and Delaware (98.1%, a difference of 0.0%).
| Demographics | Rating | Rank | 3rd Grade |
| Osage | 99.2 /100 | #78 | Exceptional 98.2% |
| Immigrants | Belgium | 99.1 /100 | #79 | Exceptional 98.1% |
| Macedonians | 99.1 /100 | #80 | Exceptional 98.1% |
| Icelanders | 99.1 /100 | #81 | Exceptional 98.1% |
| Shoshone | 99.0 /100 | #82 | Exceptional 98.1% |
| Ukrainians | 98.9 /100 | #83 | Exceptional 98.1% |
| Immigrants | Sweden | 98.9 /100 | #84 | Exceptional 98.1% |
| Immigrants | Australia | 98.9 /100 | #85 | Exceptional 98.1% |
| Potawatomi | 98.9 /100 | #86 | Exceptional 98.1% |
| Immigrants | Denmark | 98.8 /100 | #87 | Exceptional 98.1% |
| Immigrants | India | 98.8 /100 | #88 | Exceptional 98.1% |
| Delaware | 98.8 /100 | #89 | Exceptional 98.1% |
| Zimbabweans | 98.8 /100 | #90 | Exceptional 98.1% |
| Hopi | 98.7 /100 | #91 | Exceptional 98.1% |
| Immigrants | South Africa | 98.7 /100 | #92 | Exceptional 98.1% |