Egyptian vs Immigrants from Thailand 3rd Grade
COMPARE
Egyptian
Immigrants from Thailand
3rd Grade
3rd Grade Comparison
Egyptians
Immigrants from Thailand
97.7%
3RD GRADE
46.6/ 100
METRIC RATING
177th/ 347
METRIC RANK
97.1%
3RD GRADE
0.0/ 100
METRIC RATING
289th/ 347
METRIC RANK
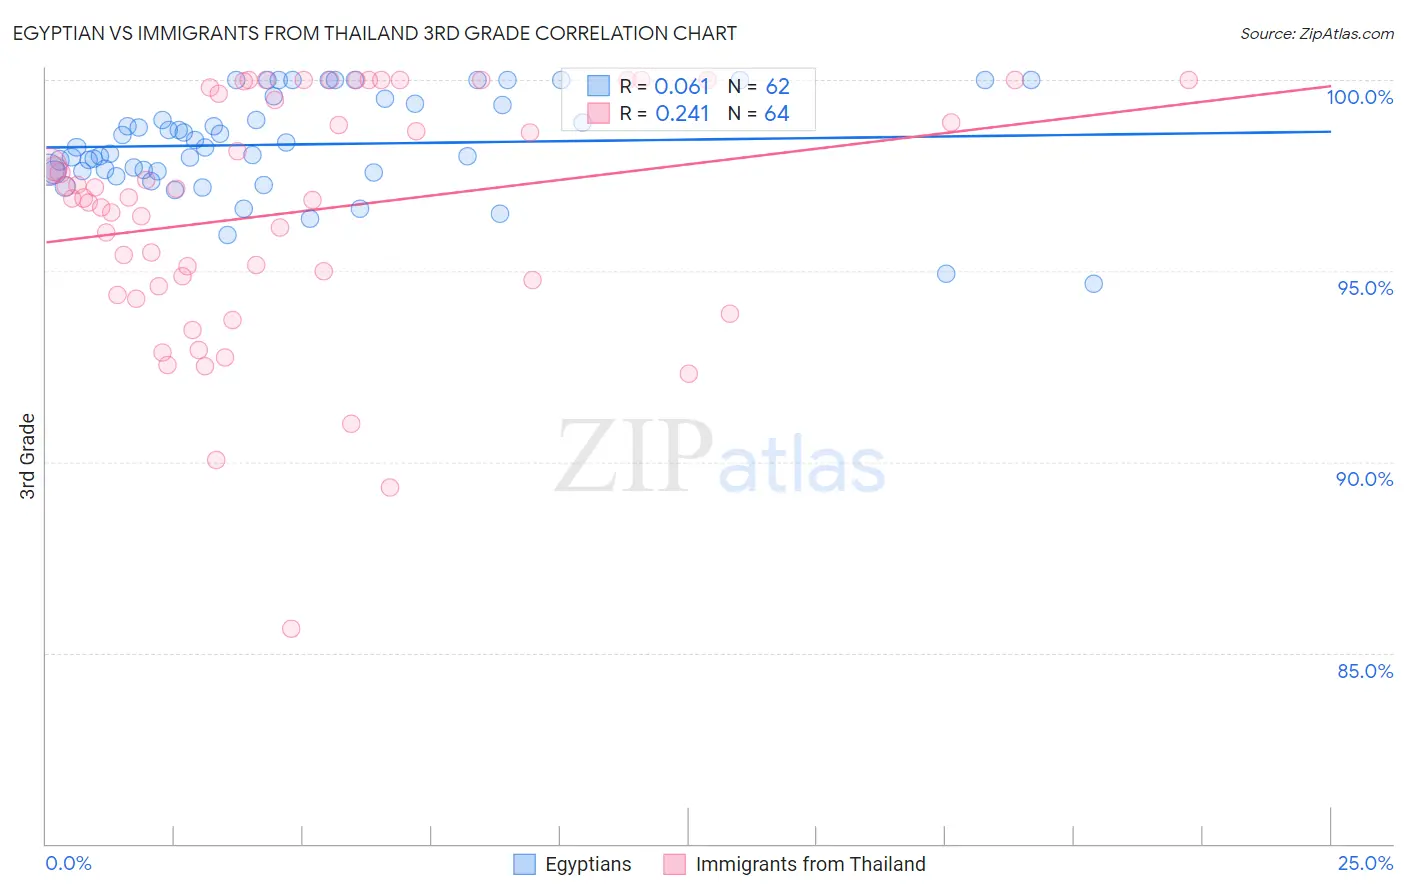
Egyptian vs Immigrants from Thailand 3rd Grade Correlation Chart
The statistical analysis conducted on geographies consisting of 276,927,423 people shows a slight positive correlation between the proportion of Egyptians and percentage of population with at least 3rd grade education in the United States with a correlation coefficient (R) of 0.061 and weighted average of 97.7%. Similarly, the statistical analysis conducted on geographies consisting of 317,003,309 people shows a weak positive correlation between the proportion of Immigrants from Thailand and percentage of population with at least 3rd grade education in the United States with a correlation coefficient (R) of 0.241 and weighted average of 97.1%, a difference of 0.70%.
3rd Grade Correlation Summary
| Measurement | Egyptian | Immigrants from Thailand |
| Minimum | 94.7% | 85.6% |
| Maximum | 100.0% | 100.0% |
| Range | 5.3% | 14.4% |
| Mean | 98.3% | 96.6% |
| Median | 98.2% | 96.9% |
| Interquartile 25% (IQ1) | 97.6% | 94.7% |
| Interquartile 75% (IQ3) | 99.4% | 99.7% |
| Interquartile Range (IQR) | 1.8% | 5.0% |
| Standard Deviation (Sample) | 1.3% | 3.2% |
| Standard Deviation (Population) | 1.3% | 3.1% |
Similar Demographics by 3rd Grade
Demographics Similar to Egyptians by 3rd Grade
In terms of 3rd grade, the demographic groups most similar to Egyptians are Immigrants from Micronesia (97.8%, a difference of 0.0%), Immigrants from Poland (97.8%, a difference of 0.0%), Immigrants from Brazil (97.7%, a difference of 0.0%), Immigrants from Belarus (97.7%, a difference of 0.0%), and Immigrants from Korea (97.8%, a difference of 0.010%).
| Demographics | Rating | Rank | 3rd Grade |
| Brazilians | 53.7 /100 | #170 | Average 97.8% |
| Kenyans | 51.8 /100 | #171 | Average 97.8% |
| Spanish Americans | 51.8 /100 | #172 | Average 97.8% |
| Immigrants | Korea | 50.9 /100 | #173 | Average 97.8% |
| Navajo | 50.0 /100 | #174 | Average 97.8% |
| Immigrants | Micronesia | 47.6 /100 | #175 | Average 97.8% |
| Immigrants | Poland | 47.1 /100 | #176 | Average 97.8% |
| Egyptians | 46.6 /100 | #177 | Average 97.7% |
| Immigrants | Brazil | 46.4 /100 | #178 | Average 97.7% |
| Immigrants | Belarus | 45.9 /100 | #179 | Average 97.7% |
| Immigrants | Sri Lanka | 45.1 /100 | #180 | Average 97.7% |
| Immigrants | Venezuela | 44.4 /100 | #181 | Average 97.7% |
| Argentineans | 42.9 /100 | #182 | Average 97.7% |
| Arabs | 40.0 /100 | #183 | Fair 97.7% |
| Immigrants | Kazakhstan | 37.4 /100 | #184 | Fair 97.7% |
Demographics Similar to Immigrants from Thailand by 3rd Grade
In terms of 3rd grade, the demographic groups most similar to Immigrants from Thailand are Immigrants from West Indies (97.1%, a difference of 0.010%), Immigrants from Barbados (97.1%, a difference of 0.020%), Immigrants from St. Vincent and the Grenadines (97.1%, a difference of 0.020%), Immigrants from Hong Kong (97.1%, a difference of 0.030%), and Immigrants from Portugal (97.0%, a difference of 0.030%).
| Demographics | Rating | Rank | 3rd Grade |
| Afghans | 0.1 /100 | #282 | Tragic 97.1% |
| Houma | 0.1 /100 | #283 | Tragic 97.1% |
| Immigrants | Trinidad and Tobago | 0.0 /100 | #284 | Tragic 97.1% |
| Immigrants | Hong Kong | 0.0 /100 | #285 | Tragic 97.1% |
| Immigrants | Barbados | 0.0 /100 | #286 | Tragic 97.1% |
| Immigrants | St. Vincent and the Grenadines | 0.0 /100 | #287 | Tragic 97.1% |
| Immigrants | West Indies | 0.0 /100 | #288 | Tragic 97.1% |
| Immigrants | Thailand | 0.0 /100 | #289 | Tragic 97.1% |
| Immigrants | Portugal | 0.0 /100 | #290 | Tragic 97.0% |
| Immigrants | Afghanistan | 0.0 /100 | #291 | Tragic 97.0% |
| British West Indians | 0.0 /100 | #292 | Tragic 97.0% |
| Immigrants | Grenada | 0.0 /100 | #293 | Tragic 97.0% |
| Malaysians | 0.0 /100 | #294 | Tragic 97.0% |
| Immigrants | Eritrea | 0.0 /100 | #295 | Tragic 97.0% |
| Immigrants | Immigrants | 0.0 /100 | #296 | Tragic 96.9% |