Ecuadorian vs Immigrants from Switzerland 10th Grade
COMPARE
Ecuadorian
Immigrants from Switzerland
10th Grade
10th Grade Comparison
Ecuadorians
Immigrants from Switzerland
90.6%
10TH GRADE
0.0/ 100
METRIC RATING
316th/ 347
METRIC RANK
94.6%
10TH GRADE
98.3/ 100
METRIC RATING
96th/ 347
METRIC RANK
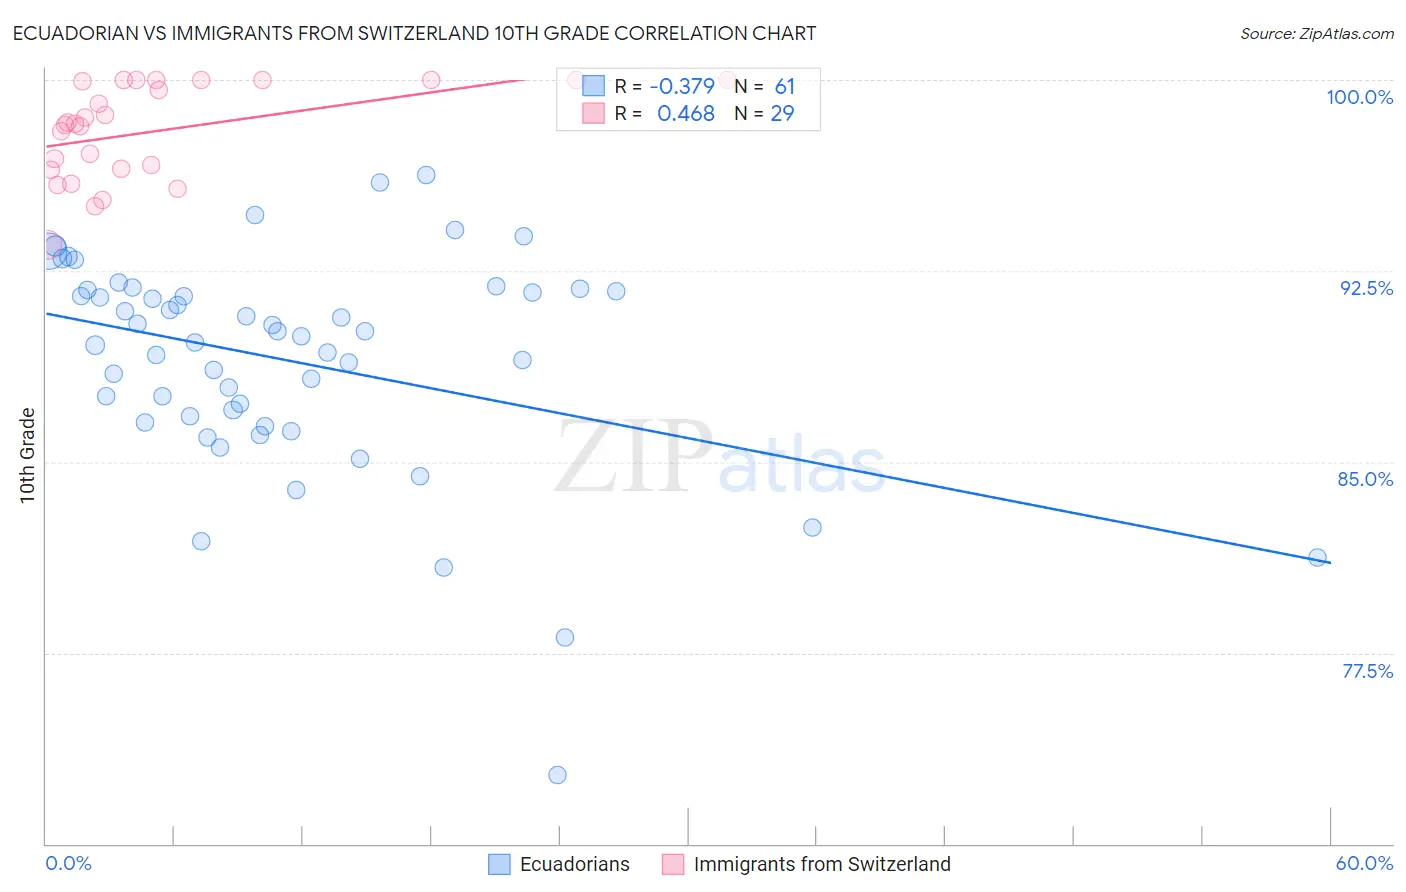
Ecuadorian vs Immigrants from Switzerland 10th Grade Correlation Chart
The statistical analysis conducted on geographies consisting of 317,864,750 people shows a mild negative correlation between the proportion of Ecuadorians and percentage of population with at least 10th grade education in the United States with a correlation coefficient (R) of -0.379 and weighted average of 90.6%. Similarly, the statistical analysis conducted on geographies consisting of 148,082,451 people shows a moderate positive correlation between the proportion of Immigrants from Switzerland and percentage of population with at least 10th grade education in the United States with a correlation coefficient (R) of 0.468 and weighted average of 94.6%, a difference of 4.4%.
10th Grade Correlation Summary
| Measurement | Ecuadorian | Immigrants from Switzerland |
| Minimum | 72.7% | 93.5% |
| Maximum | 96.2% | 100.0% |
| Range | 23.5% | 6.5% |
| Mean | 89.0% | 98.0% |
| Median | 89.9% | 98.3% |
| Interquartile 25% (IQ1) | 86.7% | 96.5% |
| Interquartile 75% (IQ3) | 91.7% | 100.0% |
| Interquartile Range (IQR) | 5.1% | 3.5% |
| Standard Deviation (Sample) | 4.3% | 1.9% |
| Standard Deviation (Population) | 4.3% | 1.8% |
Similar Demographics by 10th Grade
Demographics Similar to Ecuadorians by 10th Grade
In terms of 10th grade, the demographic groups most similar to Ecuadorians are Immigrants from Caribbean (90.6%, a difference of 0.010%), Nepalese (90.7%, a difference of 0.090%), Cape Verdean (90.8%, a difference of 0.17%), Immigrants from Ecuador (90.4%, a difference of 0.17%), and Immigrants from Portugal (90.8%, a difference of 0.20%).
| Demographics | Rating | Rank | 10th Grade |
| Immigrants | Immigrants | 0.0 /100 | #309 | Tragic 91.0% |
| Vietnamese | 0.0 /100 | #310 | Tragic 90.9% |
| Immigrants | Cambodia | 0.0 /100 | #311 | Tragic 90.9% |
| Immigrants | Portugal | 0.0 /100 | #312 | Tragic 90.8% |
| Cape Verdeans | 0.0 /100 | #313 | Tragic 90.8% |
| Nepalese | 0.0 /100 | #314 | Tragic 90.7% |
| Immigrants | Caribbean | 0.0 /100 | #315 | Tragic 90.6% |
| Ecuadorians | 0.0 /100 | #316 | Tragic 90.6% |
| Immigrants | Ecuador | 0.0 /100 | #317 | Tragic 90.4% |
| Immigrants | Cuba | 0.0 /100 | #318 | Tragic 90.2% |
| Nicaraguans | 0.0 /100 | #319 | Tragic 90.2% |
| Houma | 0.0 /100 | #320 | Tragic 90.2% |
| Belizeans | 0.0 /100 | #321 | Tragic 90.2% |
| Tohono O'odham | 0.0 /100 | #322 | Tragic 90.1% |
| Immigrants | Belize | 0.0 /100 | #323 | Tragic 90.1% |
Demographics Similar to Immigrants from Switzerland by 10th Grade
In terms of 10th grade, the demographic groups most similar to Immigrants from Switzerland are Immigrants from Germany (94.6%, a difference of 0.0%), Menominee (94.6%, a difference of 0.0%), Lebanese (94.6%, a difference of 0.0%), Soviet Union (94.6%, a difference of 0.010%), and Yugoslavian (94.6%, a difference of 0.020%).
| Demographics | Rating | Rank | 10th Grade |
| Immigrants | Moldova | 98.9 /100 | #89 | Exceptional 94.7% |
| South Africans | 98.8 /100 | #90 | Exceptional 94.7% |
| Whites/Caucasians | 98.8 /100 | #91 | Exceptional 94.7% |
| Yugoslavians | 98.4 /100 | #92 | Exceptional 94.6% |
| Soviet Union | 98.3 /100 | #93 | Exceptional 94.6% |
| Immigrants | Germany | 98.3 /100 | #94 | Exceptional 94.6% |
| Menominee | 98.3 /100 | #95 | Exceptional 94.6% |
| Immigrants | Switzerland | 98.3 /100 | #96 | Exceptional 94.6% |
| Lebanese | 98.3 /100 | #97 | Exceptional 94.6% |
| Immigrants | Bulgaria | 98.1 /100 | #98 | Exceptional 94.6% |
| Immigrants | France | 97.9 /100 | #99 | Exceptional 94.5% |
| Immigrants | South Central Asia | 97.8 /100 | #100 | Exceptional 94.5% |
| Syrians | 97.7 /100 | #101 | Exceptional 94.5% |
| Cambodians | 97.6 /100 | #102 | Exceptional 94.5% |
| Immigrants | Europe | 97.5 /100 | #103 | Exceptional 94.5% |