Dutch vs Immigrants from Switzerland 10th Grade
COMPARE
Dutch
Immigrants from Switzerland
10th Grade
10th Grade Comparison
Dutch
Immigrants from Switzerland
95.5%
10TH GRADE
100.0/ 100
METRIC RATING
21st/ 347
METRIC RANK
94.6%
10TH GRADE
98.3/ 100
METRIC RATING
96th/ 347
METRIC RANK
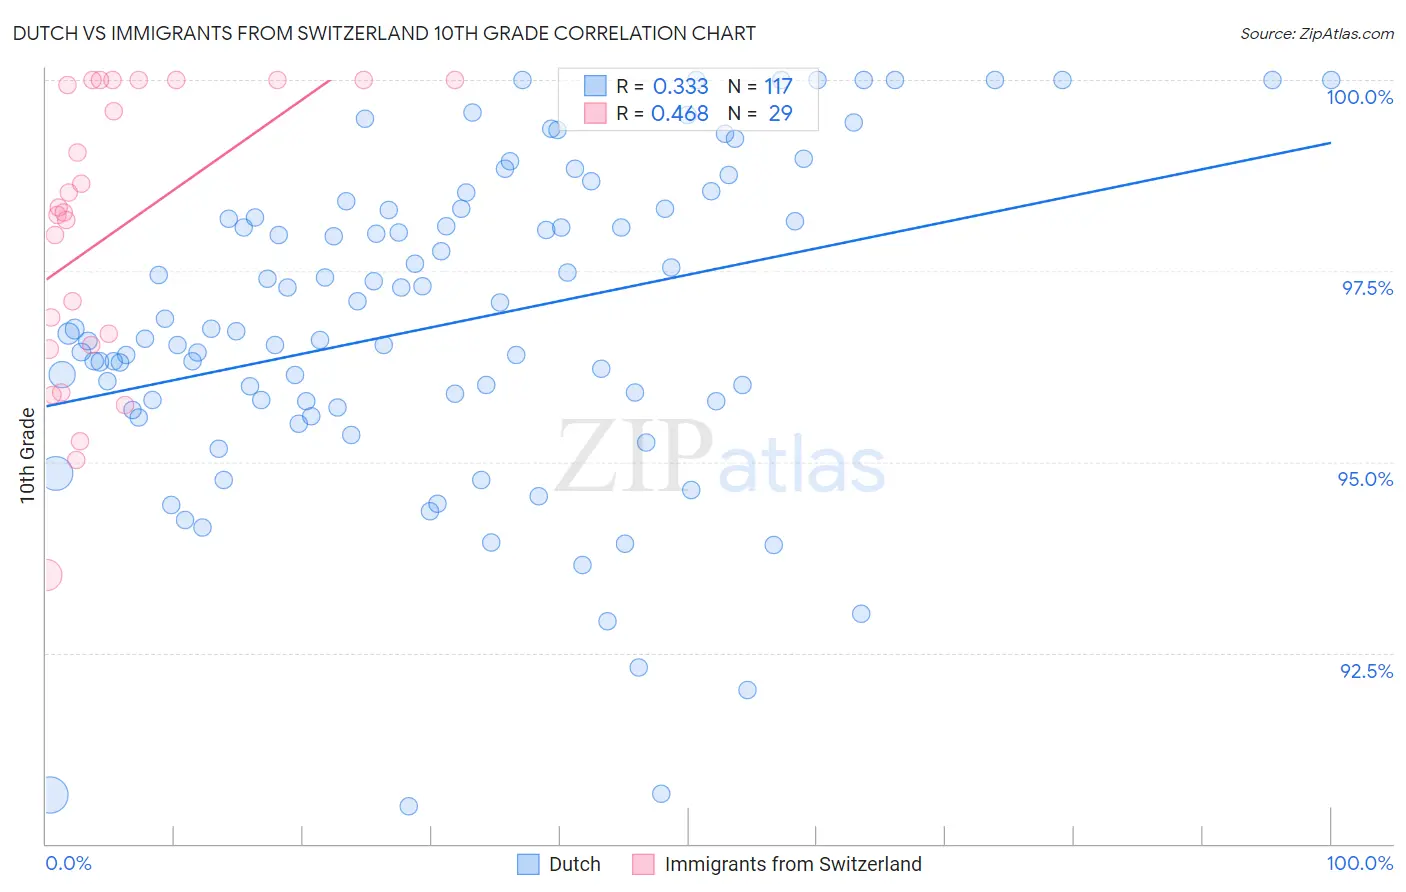
Dutch vs Immigrants from Switzerland 10th Grade Correlation Chart
The statistical analysis conducted on geographies consisting of 554,359,196 people shows a mild positive correlation between the proportion of Dutch and percentage of population with at least 10th grade education in the United States with a correlation coefficient (R) of 0.333 and weighted average of 95.5%. Similarly, the statistical analysis conducted on geographies consisting of 148,082,451 people shows a moderate positive correlation between the proportion of Immigrants from Switzerland and percentage of population with at least 10th grade education in the United States with a correlation coefficient (R) of 0.468 and weighted average of 94.6%, a difference of 1.0%.
10th Grade Correlation Summary
| Measurement | Dutch | Immigrants from Switzerland |
| Minimum | 90.5% | 93.5% |
| Maximum | 100.0% | 100.0% |
| Range | 9.5% | 6.5% |
| Mean | 96.8% | 98.0% |
| Median | 96.7% | 98.3% |
| Interquartile 25% (IQ1) | 95.8% | 96.5% |
| Interquartile 75% (IQ3) | 98.3% | 100.0% |
| Interquartile Range (IQR) | 2.6% | 3.5% |
| Standard Deviation (Sample) | 2.1% | 1.9% |
| Standard Deviation (Population) | 2.1% | 1.8% |
Similar Demographics by 10th Grade
Demographics Similar to Dutch by 10th Grade
In terms of 10th grade, the demographic groups most similar to Dutch are Chinese (95.5%, a difference of 0.010%), Italian (95.6%, a difference of 0.030%), Scandinavian (95.6%, a difference of 0.030%), Latvian (95.6%, a difference of 0.040%), and Eastern European (95.5%, a difference of 0.040%).
| Demographics | Rating | Rank | 10th Grade |
| Tsimshian | 100.0 /100 | #14 | Exceptional 95.6% |
| Irish | 100.0 /100 | #15 | Exceptional 95.6% |
| Scottish | 100.0 /100 | #16 | Exceptional 95.6% |
| Latvians | 100.0 /100 | #17 | Exceptional 95.6% |
| Italians | 100.0 /100 | #18 | Exceptional 95.6% |
| Scandinavians | 100.0 /100 | #19 | Exceptional 95.6% |
| Chinese | 100.0 /100 | #20 | Exceptional 95.5% |
| Dutch | 100.0 /100 | #21 | Exceptional 95.5% |
| Eastern Europeans | 100.0 /100 | #22 | Exceptional 95.5% |
| Czechs | 100.0 /100 | #23 | Exceptional 95.5% |
| Europeans | 100.0 /100 | #24 | Exceptional 95.5% |
| Maltese | 100.0 /100 | #25 | Exceptional 95.5% |
| Welsh | 100.0 /100 | #26 | Exceptional 95.5% |
| Alaskan Athabascans | 100.0 /100 | #27 | Exceptional 95.4% |
| Luxembourgers | 100.0 /100 | #28 | Exceptional 95.4% |
Demographics Similar to Immigrants from Switzerland by 10th Grade
In terms of 10th grade, the demographic groups most similar to Immigrants from Switzerland are Immigrants from Germany (94.6%, a difference of 0.0%), Menominee (94.6%, a difference of 0.0%), Lebanese (94.6%, a difference of 0.0%), Soviet Union (94.6%, a difference of 0.010%), and Yugoslavian (94.6%, a difference of 0.020%).
| Demographics | Rating | Rank | 10th Grade |
| Immigrants | Moldova | 98.9 /100 | #89 | Exceptional 94.7% |
| South Africans | 98.8 /100 | #90 | Exceptional 94.7% |
| Whites/Caucasians | 98.8 /100 | #91 | Exceptional 94.7% |
| Yugoslavians | 98.4 /100 | #92 | Exceptional 94.6% |
| Soviet Union | 98.3 /100 | #93 | Exceptional 94.6% |
| Immigrants | Germany | 98.3 /100 | #94 | Exceptional 94.6% |
| Menominee | 98.3 /100 | #95 | Exceptional 94.6% |
| Immigrants | Switzerland | 98.3 /100 | #96 | Exceptional 94.6% |
| Lebanese | 98.3 /100 | #97 | Exceptional 94.6% |
| Immigrants | Bulgaria | 98.1 /100 | #98 | Exceptional 94.6% |
| Immigrants | France | 97.9 /100 | #99 | Exceptional 94.5% |
| Immigrants | South Central Asia | 97.8 /100 | #100 | Exceptional 94.5% |
| Syrians | 97.7 /100 | #101 | Exceptional 94.5% |
| Cambodians | 97.6 /100 | #102 | Exceptional 94.5% |
| Immigrants | Europe | 97.5 /100 | #103 | Exceptional 94.5% |