Eastern European vs Bermudan High School Diploma
COMPARE
Eastern European
Bermudan
High School Diploma
High School Diploma Comparison
Eastern Europeans
Bermudans
91.9%
HIGH SCHOOL DIPLOMA
100.0/ 100
METRIC RATING
11th/ 347
METRIC RANK
89.3%
HIGH SCHOOL DIPLOMA
61.1/ 100
METRIC RATING
162nd/ 347
METRIC RANK
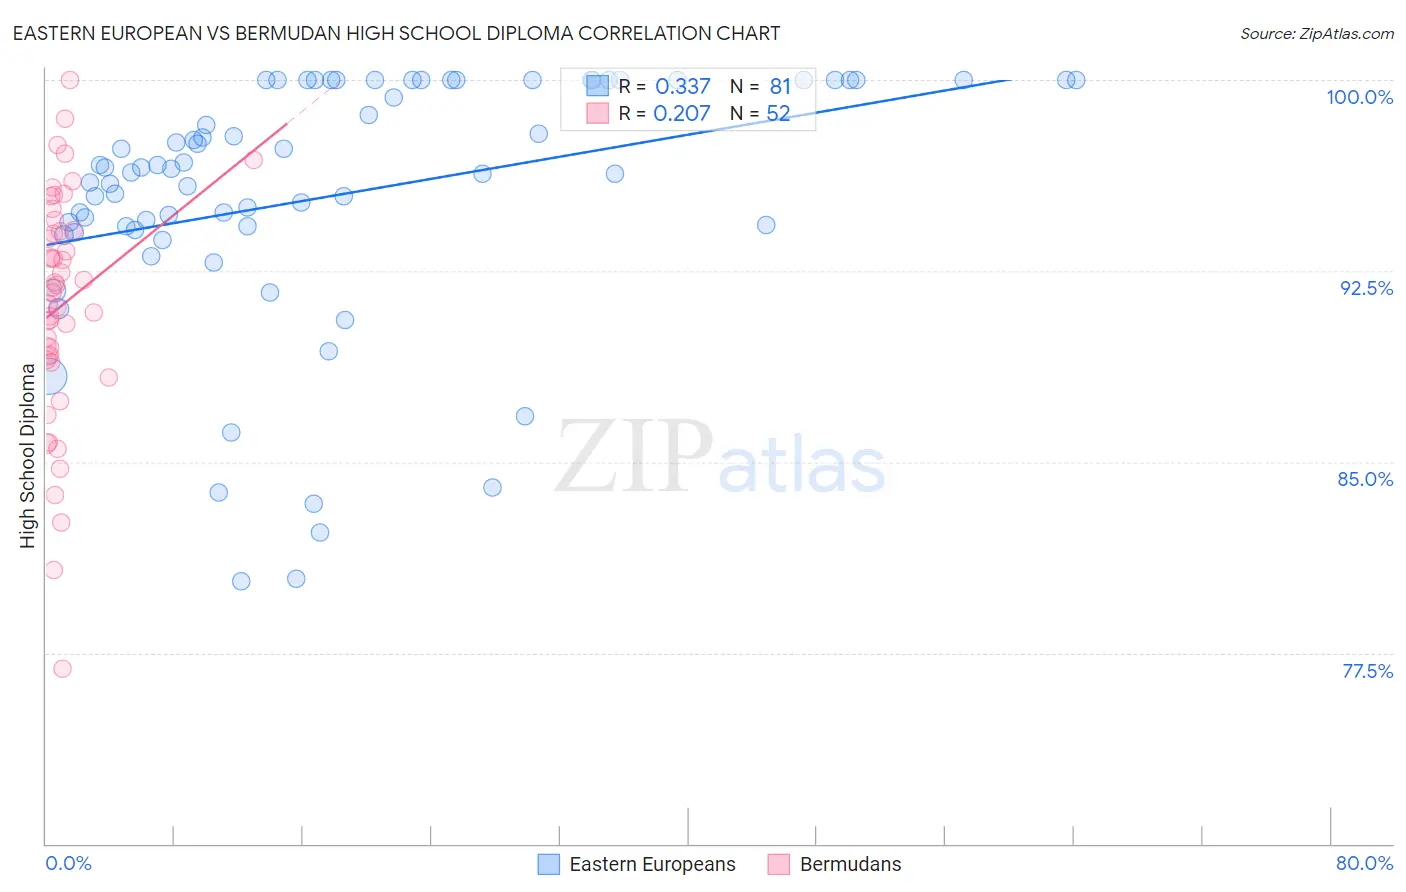
Eastern European vs Bermudan High School Diploma Correlation Chart
The statistical analysis conducted on geographies consisting of 461,247,615 people shows a mild positive correlation between the proportion of Eastern Europeans and percentage of population with at least high school diploma education in the United States with a correlation coefficient (R) of 0.337 and weighted average of 91.9%. Similarly, the statistical analysis conducted on geographies consisting of 55,730,379 people shows a weak positive correlation between the proportion of Bermudans and percentage of population with at least high school diploma education in the United States with a correlation coefficient (R) of 0.207 and weighted average of 89.3%, a difference of 2.9%.
High School Diploma Correlation Summary
| Measurement | Eastern European | Bermudan |
| Minimum | 80.3% | 76.9% |
| Maximum | 100.0% | 100.0% |
| Range | 19.7% | 23.1% |
| Mean | 95.5% | 91.1% |
| Median | 96.5% | 91.7% |
| Interquartile 25% (IQ1) | 94.2% | 89.1% |
| Interquartile 75% (IQ3) | 100.0% | 94.1% |
| Interquartile Range (IQR) | 5.8% | 5.0% |
| Standard Deviation (Sample) | 5.0% | 4.6% |
| Standard Deviation (Population) | 4.9% | 4.5% |
Similar Demographics by High School Diploma
Demographics Similar to Eastern Europeans by High School Diploma
In terms of high school diploma, the demographic groups most similar to Eastern Europeans are Polish (91.9%, a difference of 0.050%), Croatian (92.0%, a difference of 0.070%), Danish (91.8%, a difference of 0.090%), Latvian (92.0%, a difference of 0.10%), and Chinese (92.0%, a difference of 0.11%).
| Demographics | Rating | Rank | High School Diploma |
| Lithuanians | 100.0 /100 | #4 | Exceptional 92.0% |
| Slovenes | 100.0 /100 | #5 | Exceptional 92.0% |
| Slovaks | 100.0 /100 | #6 | Exceptional 92.0% |
| Immigrants | India | 100.0 /100 | #7 | Exceptional 92.0% |
| Chinese | 100.0 /100 | #8 | Exceptional 92.0% |
| Latvians | 100.0 /100 | #9 | Exceptional 92.0% |
| Croatians | 100.0 /100 | #10 | Exceptional 92.0% |
| Eastern Europeans | 100.0 /100 | #11 | Exceptional 91.9% |
| Poles | 100.0 /100 | #12 | Exceptional 91.9% |
| Danes | 100.0 /100 | #13 | Exceptional 91.8% |
| Bulgarians | 100.0 /100 | #14 | Exceptional 91.8% |
| Luxembourgers | 100.0 /100 | #15 | Exceptional 91.7% |
| Finns | 100.0 /100 | #16 | Exceptional 91.7% |
| Immigrants | Singapore | 99.9 /100 | #17 | Exceptional 91.7% |
| Germans | 99.9 /100 | #18 | Exceptional 91.7% |
Demographics Similar to Bermudans by High School Diploma
In terms of high school diploma, the demographic groups most similar to Bermudans are Brazilian (89.3%, a difference of 0.0%), Cree (89.3%, a difference of 0.0%), Immigrants from Nepal (89.3%, a difference of 0.0%), Immigrants from China (89.3%, a difference of 0.010%), and Laotian (89.3%, a difference of 0.010%).
| Demographics | Rating | Rank | High School Diploma |
| Immigrants | Northern Africa | 66.4 /100 | #155 | Good 89.4% |
| Immigrants | Argentina | 65.5 /100 | #156 | Good 89.4% |
| Immigrants | Malaysia | 63.5 /100 | #157 | Good 89.3% |
| Immigrants | Pakistan | 62.5 /100 | #158 | Good 89.3% |
| Immigrants | China | 62.0 /100 | #159 | Good 89.3% |
| Laotians | 61.8 /100 | #160 | Good 89.3% |
| Brazilians | 61.2 /100 | #161 | Good 89.3% |
| Bermudans | 61.1 /100 | #162 | Good 89.3% |
| Cree | 61.1 /100 | #163 | Good 89.3% |
| Immigrants | Nepal | 61.1 /100 | #164 | Good 89.3% |
| Immigrants | Asia | 59.8 /100 | #165 | Average 89.3% |
| Immigrants | Albania | 59.4 /100 | #166 | Average 89.3% |
| Immigrants | Hong Kong | 58.6 /100 | #167 | Average 89.3% |
| Delaware | 55.8 /100 | #168 | Average 89.2% |
| Iroquois | 55.1 /100 | #169 | Average 89.2% |