Dutch West Indian vs Northern European 4th Grade
COMPARE
Dutch West Indian
Northern European
4th Grade
4th Grade Comparison
Dutch West Indians
Northern Europeans
97.5%
4TH GRADE
35.8/ 100
METRIC RATING
186th/ 347
METRIC RANK
98.2%
4TH GRADE
99.9/ 100
METRIC RATING
43rd/ 347
METRIC RANK
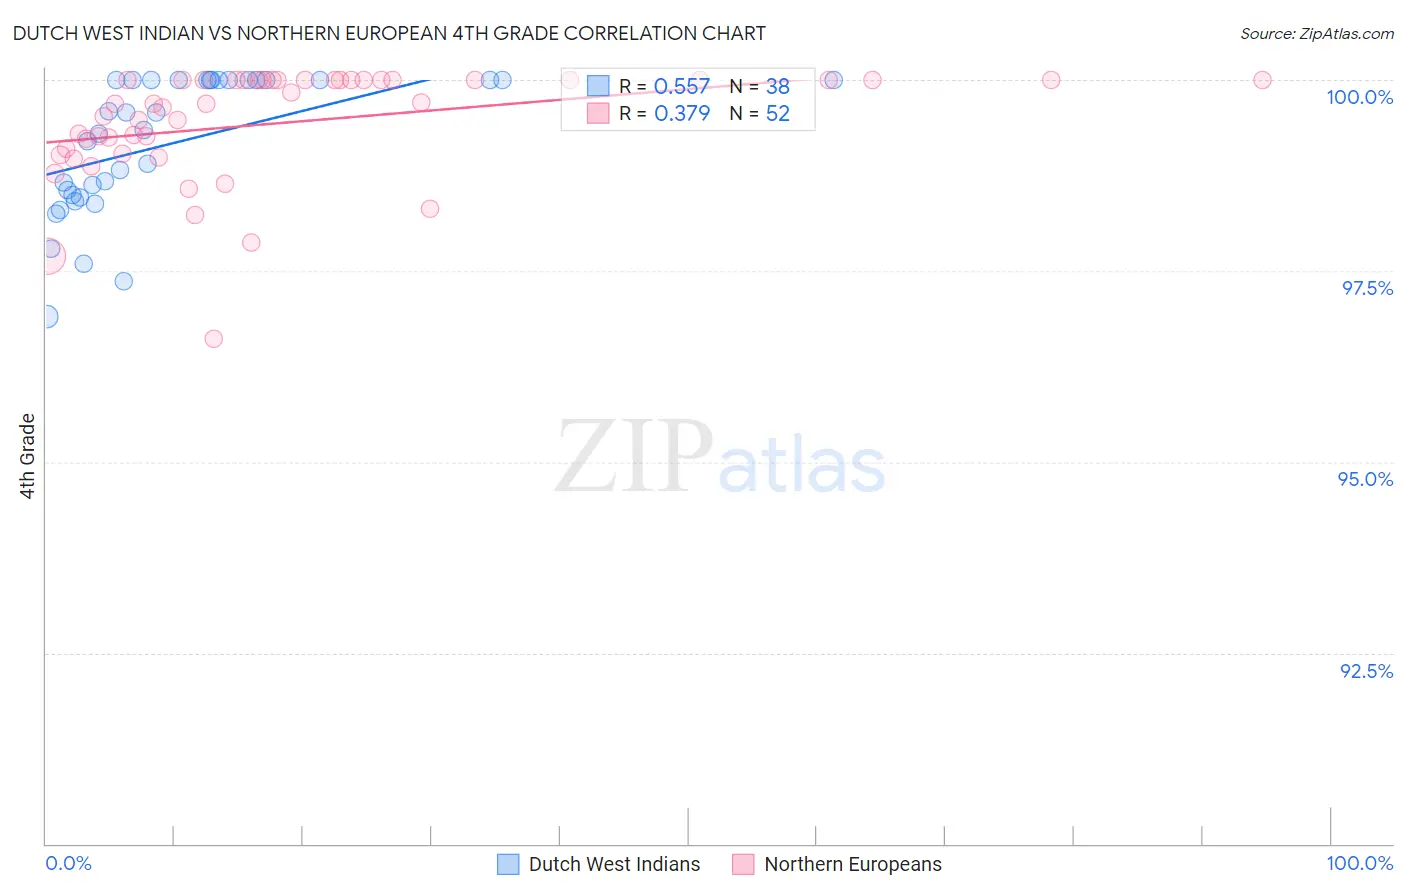
Dutch West Indian vs Northern European 4th Grade Correlation Chart
The statistical analysis conducted on geographies consisting of 85,776,075 people shows a substantial positive correlation between the proportion of Dutch West Indians and percentage of population with at least 4th grade education in the United States with a correlation coefficient (R) of 0.557 and weighted average of 97.5%. Similarly, the statistical analysis conducted on geographies consisting of 406,093,361 people shows a mild positive correlation between the proportion of Northern Europeans and percentage of population with at least 4th grade education in the United States with a correlation coefficient (R) of 0.379 and weighted average of 98.2%, a difference of 0.71%.
4th Grade Correlation Summary
| Measurement | Dutch West Indian | Northern European |
| Minimum | 96.9% | 96.6% |
| Maximum | 100.0% | 100.0% |
| Range | 3.1% | 3.4% |
| Mean | 99.2% | 99.4% |
| Median | 99.5% | 99.7% |
| Interquartile 25% (IQ1) | 98.5% | 99.1% |
| Interquartile 75% (IQ3) | 100.0% | 100.0% |
| Interquartile Range (IQR) | 1.5% | 0.93% |
| Standard Deviation (Sample) | 0.89% | 0.73% |
| Standard Deviation (Population) | 0.88% | 0.72% |
Similar Demographics by 4th Grade
Demographics Similar to Dutch West Indians by 4th Grade
In terms of 4th grade, the demographic groups most similar to Dutch West Indians are Pakistani (97.5%, a difference of 0.0%), Immigrants from Kenya (97.5%, a difference of 0.0%), Mongolian (97.5%, a difference of 0.0%), Immigrants from Argentina (97.5%, a difference of 0.0%), and Spanish American (97.5%, a difference of 0.010%).
| Demographics | Rating | Rank | 4th Grade |
| Immigrants | Kazakhstan | 43.6 /100 | #179 | Average 97.5% |
| Immigrants | Venezuela | 42.7 /100 | #180 | Average 97.5% |
| Immigrants | Taiwan | 41.5 /100 | #181 | Average 97.5% |
| Spanish Americans | 39.3 /100 | #182 | Fair 97.5% |
| Argentineans | 39.0 /100 | #183 | Fair 97.5% |
| Pakistanis | 36.2 /100 | #184 | Fair 97.5% |
| Immigrants | Kenya | 35.8 /100 | #185 | Fair 97.5% |
| Dutch West Indians | 35.8 /100 | #186 | Fair 97.5% |
| Mongolians | 34.7 /100 | #187 | Fair 97.5% |
| Immigrants | Argentina | 34.6 /100 | #188 | Fair 97.5% |
| Panamanians | 31.9 /100 | #189 | Fair 97.4% |
| Blacks/African Americans | 31.1 /100 | #190 | Fair 97.4% |
| Navajo | 30.7 /100 | #191 | Fair 97.4% |
| Immigrants | Ukraine | 30.1 /100 | #192 | Fair 97.4% |
| Immigrants | Egypt | 30.1 /100 | #193 | Fair 97.4% |
Demographics Similar to Northern Europeans by 4th Grade
In terms of 4th grade, the demographic groups most similar to Northern Europeans are Hungarian (98.2%, a difference of 0.010%), Native Hawaiian (98.1%, a difference of 0.010%), Eastern European (98.2%, a difference of 0.030%), Czechoslovakian (98.1%, a difference of 0.030%), and Ottawa (98.1%, a difference of 0.030%).
| Demographics | Rating | Rank | 4th Grade |
| British | 100.0 /100 | #36 | Exceptional 98.2% |
| Latvians | 99.9 /100 | #37 | Exceptional 98.2% |
| Aleuts | 99.9 /100 | #38 | Exceptional 98.2% |
| Belgians | 99.9 /100 | #39 | Exceptional 98.2% |
| Luxembourgers | 99.9 /100 | #40 | Exceptional 98.2% |
| Eastern Europeans | 99.9 /100 | #41 | Exceptional 98.2% |
| Hungarians | 99.9 /100 | #42 | Exceptional 98.2% |
| Northern Europeans | 99.9 /100 | #43 | Exceptional 98.2% |
| Native Hawaiians | 99.9 /100 | #44 | Exceptional 98.1% |
| Czechoslovakians | 99.9 /100 | #45 | Exceptional 98.1% |
| Ottawa | 99.9 /100 | #46 | Exceptional 98.1% |
| Arapaho | 99.9 /100 | #47 | Exceptional 98.1% |
| Estonians | 99.8 /100 | #48 | Exceptional 98.1% |
| Bulgarians | 99.8 /100 | #49 | Exceptional 98.1% |
| Immigrants | Scotland | 99.8 /100 | #50 | Exceptional 98.1% |