Ute vs New Zealander 12th Grade, No Diploma
COMPARE
Ute
New Zealander
12th Grade, No Diploma
12th Grade, No Diploma Comparison
Ute
New Zealanders
89.0%
12TH GRADE, NO DIPLOMA
0.1/ 100
METRIC RATING
276th/ 347
METRIC RANK
92.8%
12TH GRADE, NO DIPLOMA
99.7/ 100
METRIC RATING
56th/ 347
METRIC RANK
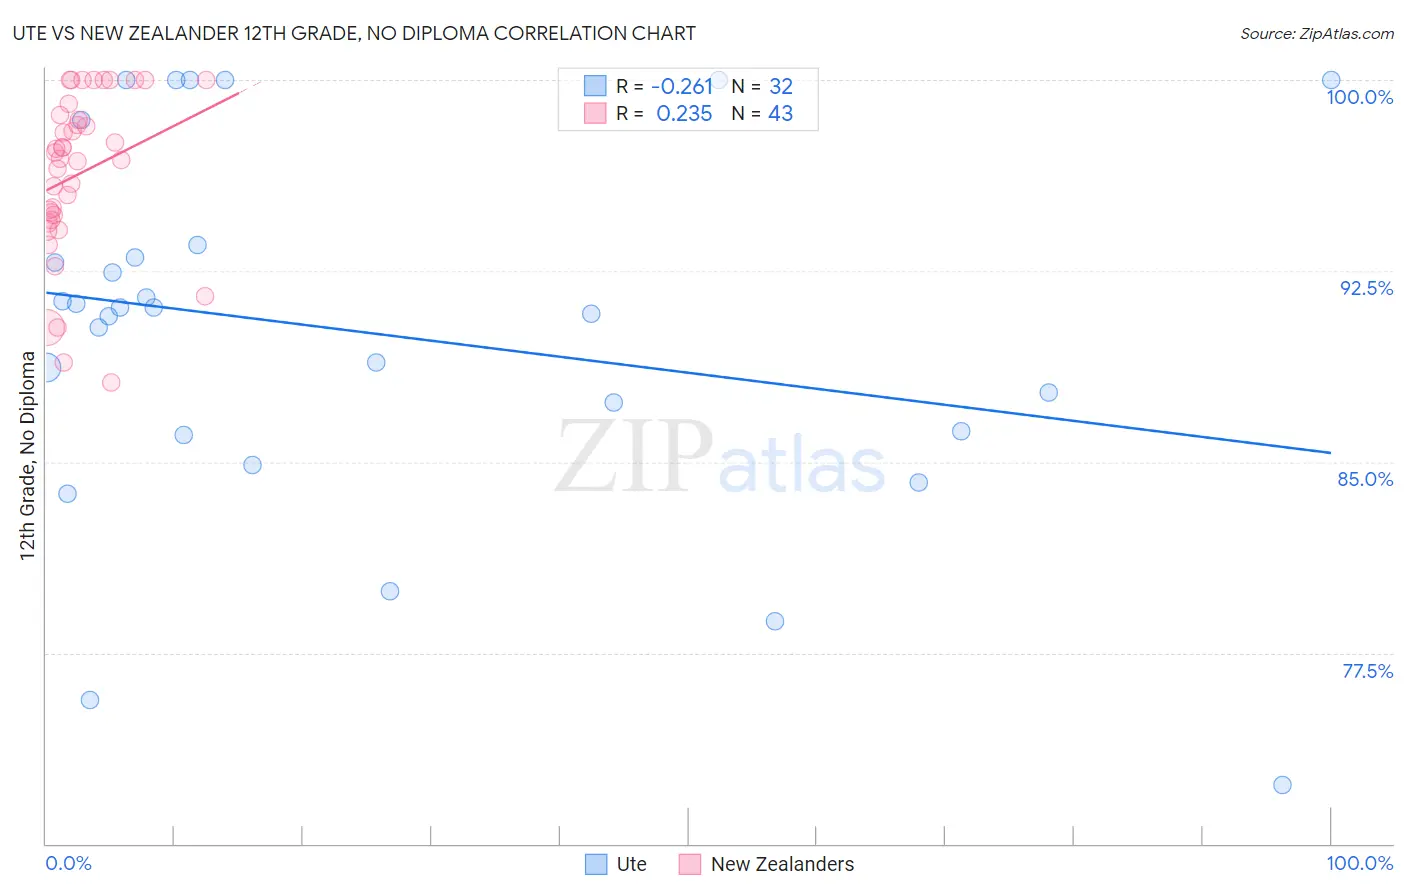
Ute vs New Zealander 12th Grade, No Diploma Correlation Chart
The statistical analysis conducted on geographies consisting of 55,668,599 people shows a weak negative correlation between the proportion of Ute and percentage of population with at least 12th grade (no diploma) education in the United States with a correlation coefficient (R) of -0.261 and weighted average of 89.0%. Similarly, the statistical analysis conducted on geographies consisting of 106,912,053 people shows a weak positive correlation between the proportion of New Zealanders and percentage of population with at least 12th grade (no diploma) education in the United States with a correlation coefficient (R) of 0.235 and weighted average of 92.8%, a difference of 4.3%.
12th Grade, No Diploma Correlation Summary
| Measurement | Ute | New Zealander |
| Minimum | 72.3% | 88.1% |
| Maximum | 100.0% | 100.0% |
| Range | 27.7% | 11.9% |
| Mean | 90.1% | 96.3% |
| Median | 91.0% | 96.9% |
| Interquartile 25% (IQ1) | 86.1% | 94.5% |
| Interquartile 75% (IQ3) | 93.3% | 98.6% |
| Interquartile Range (IQR) | 7.2% | 4.1% |
| Standard Deviation (Sample) | 7.2% | 3.2% |
| Standard Deviation (Population) | 7.1% | 3.1% |
Similar Demographics by 12th Grade, No Diploma
Demographics Similar to Ute by 12th Grade, No Diploma
In terms of 12th grade, no diploma, the demographic groups most similar to Ute are Immigrants from Congo (89.0%, a difference of 0.0%), Immigrants from Barbados (89.0%, a difference of 0.050%), Cajun (89.1%, a difference of 0.070%), Barbadian (89.1%, a difference of 0.090%), and Immigrants from St. Vincent and the Grenadines (88.9%, a difference of 0.12%).
| Demographics | Rating | Rank | 12th Grade, No Diploma |
| U.S. Virgin Islanders | 0.1 /100 | #269 | Tragic 89.3% |
| Bangladeshis | 0.1 /100 | #270 | Tragic 89.3% |
| Blacks/African Americans | 0.1 /100 | #271 | Tragic 89.3% |
| Malaysians | 0.1 /100 | #272 | Tragic 89.2% |
| Barbadians | 0.1 /100 | #273 | Tragic 89.1% |
| Cajuns | 0.1 /100 | #274 | Tragic 89.1% |
| Immigrants | Congo | 0.1 /100 | #275 | Tragic 89.0% |
| Ute | 0.1 /100 | #276 | Tragic 89.0% |
| Immigrants | Barbados | 0.0 /100 | #277 | Tragic 89.0% |
| Immigrants | St. Vincent and the Grenadines | 0.0 /100 | #278 | Tragic 88.9% |
| Immigrants | Laos | 0.0 /100 | #279 | Tragic 88.9% |
| Immigrants | Burma/Myanmar | 0.0 /100 | #280 | Tragic 88.9% |
| Cubans | 0.0 /100 | #281 | Tragic 88.9% |
| Immigrants | Vietnam | 0.0 /100 | #282 | Tragic 88.7% |
| Paiute | 0.0 /100 | #283 | Tragic 88.7% |
Demographics Similar to New Zealanders by 12th Grade, No Diploma
In terms of 12th grade, no diploma, the demographic groups most similar to New Zealanders are Serbian (92.8%, a difference of 0.010%), Hungarian (92.8%, a difference of 0.010%), Welsh (92.8%, a difference of 0.010%), Immigrants from Sweden (92.8%, a difference of 0.020%), and Immigrants from Canada (92.8%, a difference of 0.030%).
| Demographics | Rating | Rank | 12th Grade, No Diploma |
| Macedonians | 99.8 /100 | #49 | Exceptional 92.9% |
| Tsimshian | 99.8 /100 | #50 | Exceptional 92.9% |
| Immigrants | Belgium | 99.8 /100 | #51 | Exceptional 92.9% |
| Immigrants | Sweden | 99.8 /100 | #52 | Exceptional 92.8% |
| Serbians | 99.7 /100 | #53 | Exceptional 92.8% |
| Hungarians | 99.7 /100 | #54 | Exceptional 92.8% |
| Welsh | 99.7 /100 | #55 | Exceptional 92.8% |
| New Zealanders | 99.7 /100 | #56 | Exceptional 92.8% |
| Immigrants | Canada | 99.7 /100 | #57 | Exceptional 92.8% |
| Immigrants | Taiwan | 99.7 /100 | #58 | Exceptional 92.8% |
| Immigrants | North America | 99.7 /100 | #59 | Exceptional 92.8% |
| Slavs | 99.7 /100 | #60 | Exceptional 92.8% |
| Immigrants | Japan | 99.7 /100 | #61 | Exceptional 92.8% |
| Ukrainians | 99.6 /100 | #62 | Exceptional 92.7% |
| Zimbabweans | 99.6 /100 | #63 | Exceptional 92.7% |