Delaware vs Austrian 7th Grade

COMPARE

Delaware
Race
Ancestry
AfghanAfricanAlaska NativeAlaskan AthabascanAlbanianAleutAlsatianAmericanApacheArabArapahoArgentineanArmenianAssyrian/Chaldean/SyriacAustralianBahamianBangladeshiBarbadianBasqueBelgianBelizeanBermudanBhutaneseBlackfeetBolivianBrazilianBritishBritish West IndianBulgarianBurmeseCajunCambodianCanadianCape VerdeanCarpatho RusynCelticCentral AmericanCentral American IndianCherokeeCheyenneChickasawChileanChineseChippewaChoctawColombianColvilleComancheCosta RicanCreeCreekCroatianCrowCubanCypriotCzechCzechoslovakianDanishDelawareDominicanDutchDutch West IndianEastern EuropeanEcuadorianEgyptianEnglishEstonianEthiopianEuropeanFijianFilipinoFinnishFrenchFrench American IndianFrench CanadianGermanGerman RussianGhanaianGreekGuamanian/ChamorroGuatemalanGuyaneseHaitianHmongHonduranHopiHoumaHungarianIcelanderIndian (Asian)IndonesianInupiatIranianIraqiIrishIroquoisIsraeliItalianJamaicanJapaneseJordanianKenyanKiowaKoreanLaotianLatvianLebaneseLiberianLithuanianLumbeeLuxembourgerMacedonianMalaysianMalteseMarshalleseMenomineeMexicanMexican American IndianMongolianMoroccanNative HawaiianNavajoNepaleseNew ZealanderNicaraguanNigerianNorthern EuropeanNorwegianOkinawanOsageOttawaPaiutePakistaniPalestinianPanamanianParaguayanPennsylvania GermanPeruvianPimaPolishPortuguesePotawatomiPuebloPuerto RicanPuget Sound SalishRomanianRussianSalvadoranSamoanScandinavianScotch-IrishScottishSeminoleSenegaleseSerbianShoshoneSierra LeoneanSiouxSlavicSlovakSloveneSomaliSouth AfricanSouth AmericanSouth American IndianSoviet UnionSpaniardSpanishSpanish AmericanSpanish American IndianSri LankanSubsaharan AfricanSudaneseSwedishSwissSyrianTaiwaneseThaiTlingit-HaidaTohono O'OdhamTonganTrinidadian and TobagonianTsimshianTurkishU.S. Virgin IslanderUgandanUkrainianUruguayanUteVenezuelanVietnameseWelshWest IndianYakamaYaquiYugoslavianYumanYup'ikZimbabwean
Immigration
NonimmigrantsImmigrantsAfghanistanAfricaAlbaniaArgentinaArmeniaAsiaAustraliaAustriaBahamasBangladeshBarbadosBelarusBelgiumBelizeBoliviaBosnia and HerzegovinaBrazilBulgariaBurma/MyanmarCabo VerdeCambodiaCameroonCanadaCaribbeanCentral AmericaChileChinaColombiaCongoCosta RicaCroatiaCubaCzechoslovakiaDenmarkDominicaDominican RepublicEastern AfricaEastern AsiaEastern EuropeEcuadorEgyptEl SalvadorEnglandEritreaEthiopiaEuropeFijiFranceGermanyGhanaGreeceGrenadaGuatemalaGuyanaHaitiHondurasHong KongHungaryIndiaIndonesiaIranIraqIrelandIsraelItalyJamaicaJapanJordanKazakhstanKenyaKoreaKuwaitLaosLatin AmericaLatviaLebanonLiberiaLithuaniaMalaysiaMexicoMicronesiaMiddle AfricaMoldovaMoroccoNepalNetherlandsNicaraguaNigeriaNorth AmericaNorth MacedoniaNorthern AfricaNorthern EuropeNorwayOceaniaPakistanPanamaPeruPhilippinesPolandPortugalRomaniaRussiaSaudi ArabiaScotlandSenegalSerbiaSierra LeoneSingaporeSomaliaSouth AfricaSouth AmericaSouth Central AsiaSouth Eastern AsiaSouthern EuropeSpainSri LankaSt. Vincent and the GrenadinesSudanSwedenSwitzerlandSyriaTaiwanThailandTrinidad and TobagoTurkeyUgandaUkraineUruguayUzbekistanVenezuelaVietnamWest IndiesWestern AfricaWestern AsiaWestern EuropeYemenZaireZimbabweAzores
Austrian
Race
Ancestry
AfghanAfricanAlaska NativeAlaskan AthabascanAlbanianAleutAlsatianAmericanApacheArabArapahoArgentineanArmenianAssyrian/Chaldean/SyriacAustralianAustrianBahamianBangladeshiBarbadianBasqueBelgianBelizeanBermudanBhutaneseBlackfeetBolivianBrazilianBritishBritish West IndianBulgarianBurmeseCajunCambodianCanadianCape VerdeanCarpatho RusynCelticCentral AmericanCentral American IndianCherokeeCheyenneChickasawChileanChineseChippewaChoctawColombianColvilleComancheCosta RicanCreeCreekCroatianCrowCubanCypriotCzechCzechoslovakianDanishDominicanDutchDutch West IndianEastern EuropeanEcuadorianEgyptianEnglishEstonianEthiopianEuropeanFijianFilipinoFinnishFrenchFrench American IndianFrench CanadianGermanGerman RussianGhanaianGreekGuamanian/ChamorroGuatemalanGuyaneseHaitianHmongHonduranHopiHoumaHungarianIcelanderIndian (Asian)IndonesianInupiatIranianIraqiIrishIroquoisIsraeliItalianJamaicanJapaneseJordanianKenyanKiowaKoreanLaotianLatvianLebaneseLiberianLithuanianLumbeeLuxembourgerMacedonianMalaysianMalteseMarshalleseMenomineeMexicanMexican American IndianMongolianMoroccanNative HawaiianNavajoNepaleseNew ZealanderNicaraguanNigerianNorthern EuropeanNorwegianOkinawanOsageOttawaPaiutePakistaniPalestinianPanamanianParaguayanPennsylvania GermanPeruvianPimaPolishPortuguesePotawatomiPuebloPuerto RicanPuget Sound SalishRomanianRussianSalvadoranSamoanScandinavianScotch-IrishScottishSeminoleSenegaleseSerbianShoshoneSierra LeoneanSiouxSlavicSlovakSloveneSomaliSouth AfricanSouth AmericanSouth American IndianSoviet UnionSpaniardSpanishSpanish AmericanSpanish American IndianSri LankanSubsaharan AfricanSudaneseSwedishSwissSyrianTaiwaneseThaiTlingit-HaidaTohono O'OdhamTonganTrinidadian and TobagonianTsimshianTurkishU.S. Virgin IslanderUgandanUkrainianUruguayanUteVenezuelanVietnameseWelshWest IndianYakamaYaquiYugoslavianYumanYup'ikZimbabwean
Immigration
NonimmigrantsImmigrantsAfghanistanAfricaAlbaniaArgentinaArmeniaAsiaAustraliaAustriaBahamasBangladeshBarbadosBelarusBelgiumBelizeBoliviaBosnia and HerzegovinaBrazilBulgariaBurma/MyanmarCabo VerdeCambodiaCameroonCanadaCaribbeanCentral AmericaChileChinaColombiaCongoCosta RicaCroatiaCubaCzechoslovakiaDenmarkDominicaDominican RepublicEastern AfricaEastern AsiaEastern EuropeEcuadorEgyptEl SalvadorEnglandEritreaEthiopiaEuropeFijiFranceGermanyGhanaGreeceGrenadaGuatemalaGuyanaHaitiHondurasHong KongHungaryIndiaIndonesiaIranIraqIrelandIsraelItalyJamaicaJapanJordanKazakhstanKenyaKoreaKuwaitLaosLatin AmericaLatviaLebanonLiberiaLithuaniaMalaysiaMexicoMicronesiaMiddle AfricaMoldovaMoroccoNepalNetherlandsNicaraguaNigeriaNorth AmericaNorth MacedoniaNorthern AfricaNorthern EuropeNorwayOceaniaPakistanPanamaPeruPhilippinesPolandPortugalRomaniaRussiaSaudi ArabiaScotlandSenegalSerbiaSierra LeoneSingaporeSomaliaSouth AfricaSouth AmericaSouth Central AsiaSouth Eastern AsiaSouthern EuropeSpainSri LankaSt. Vincent and the GrenadinesSudanSwedenSwitzerlandSyriaTaiwanThailandTrinidad and TobagoTurkeyUgandaUkraineUruguayUzbekistanVenezuelaVietnamWest IndiesWestern AfricaWestern AsiaWestern EuropeYemenZaireZimbabweAzores
7th Grade
Income
Poverty
Unemployment
Labor Participation
Family Structure
Vehicle Availability
Education Level
Disability

7th Grade Comparison

Delaware

Austrians

Exceptional
Exceptional
96.8%
7TH GRADE
99.2/ 100
METRIC RATING
81st/ 347
METRIC RANK
97.0%
7TH GRADE
99.8/ 100
METRIC RATING
53rd/ 347
METRIC RANK

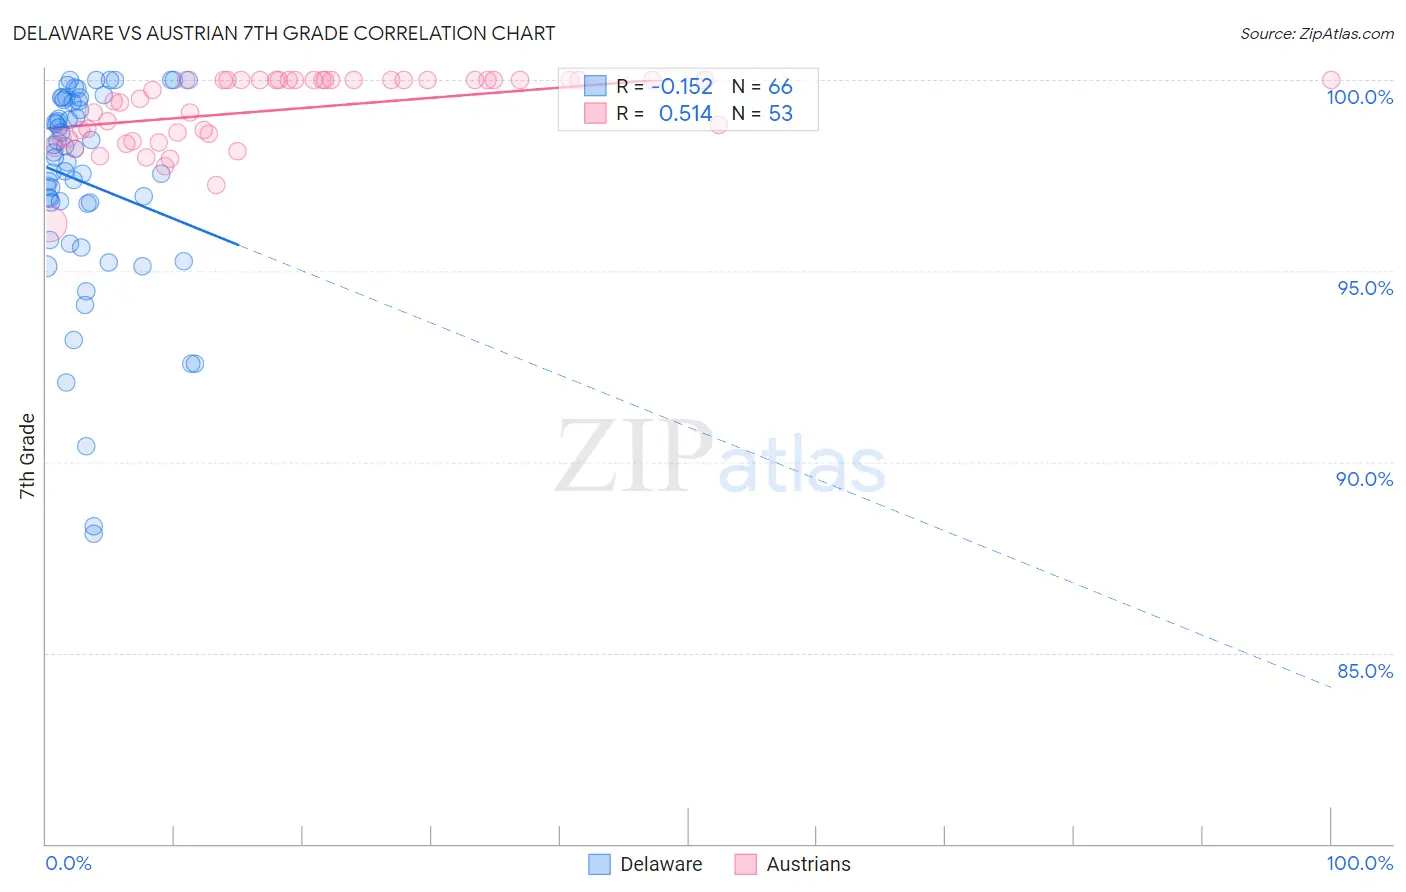
Delaware vs Austrian 7th Grade Correlation Chart

The statistical analysis conducted on geographies consisting of 96,234,659 people shows a poor negative correlation between the proportion of Delaware and percentage of population with at least 7th grade education in the United States with a correlation coefficient (R) of -0.152 and weighted average of 96.8%. Similarly, the statistical analysis conducted on geographies consisting of 452,080,344 people shows a substantial positive correlation between the proportion of Austrians and percentage of population with at least 7th grade education in the United States with a correlation coefficient (R) of 0.514 and weighted average of 97.0%, a difference of 0.25%.
Delaware vs Austrian 7th Grade

7th Grade Correlation Summary

MeasurementDelawareAustrian
Minimum88.1%96.3%
Maximum100.0%100.0%
Range11.9%3.7%
Mean97.3%99.2%
Median98.0%99.7%
Interquartile 25% (IQ1)96.8%98.5%
Interquartile 75% (IQ3)99.4%100.0%
Interquartile Range (IQR)2.7%1.5%
Standard Deviation (Sample)2.7%0.92%
Standard Deviation (Population)2.7%0.91%

Similar Demographics by 7th Grade

Demographics Similar to Delaware by 7th Grade

In terms of 7th grade, the demographic groups most similar to Delaware are Chickasaw (96.7%, a difference of 0.010%), Icelander (96.7%, a difference of 0.010%), Immigrants from Netherlands (96.8%, a difference of 0.020%), Cypriot (96.8%, a difference of 0.020%), and Yugoslavian (96.8%, a difference of 0.020%).
DemographicsRating | Rank7th Grade
Immigrants | England
99.5
/100
|
#74
Exceptional
96.8%
Zimbabweans
99.5
/100
|
#75
Exceptional
96.8%
Immigrants | Ireland
99.4
/100
|
#76
Exceptional
96.8%
Cherokee
99.4
/100
|
#77
Exceptional
96.8%
Immigrants | Netherlands
99.3
/100
|
#78
Exceptional
96.8%
Cypriots
99.3
/100
|
#79
Exceptional
96.8%
Yugoslavians
99.3
/100
|
#80
Exceptional
96.8%
Delaware
99.2
/100
|
#81
Exceptional
96.8%
Chickasaw
99.2
/100
|
#82
Exceptional
96.7%
Icelanders
99.1
/100
|
#83
Exceptional
96.7%
Romanians
99.1
/100
|
#84
Exceptional
96.7%
Kiowa
99.1
/100
|
#85
Exceptional
96.7%
Turks
99.1
/100
|
#86
Exceptional
96.7%
Immigrants | Belgium
99.0
/100
|
#87
Exceptional
96.7%
Puget Sound Salish
99.0
/100
|
#88
Exceptional
96.7%

Demographics Similar to Austrians by 7th Grade

In terms of 7th grade, the demographic groups most similar to Austrians are Greek (97.0%, a difference of 0.010%), Australian (97.0%, a difference of 0.010%), Estonian (97.0%, a difference of 0.030%), Russian (97.0%, a difference of 0.030%), and Serbian (97.0%, a difference of 0.030%).
DemographicsRating | Rank7th Grade
Aleuts
99.9
/100
|
#46
Exceptional
97.1%
Bulgarians
99.9
/100
|
#47
Exceptional
97.1%
Celtics
99.9
/100
|
#48
Exceptional
97.1%
Slavs
99.9
/100
|
#49
Exceptional
97.1%
Immigrants | Scotland
99.9
/100
|
#50
Exceptional
97.1%
Estonians
99.9
/100
|
#51
Exceptional
97.0%
Greeks
99.9
/100
|
#52
Exceptional
97.0%
Austrians
99.8
/100
|
#53
Exceptional
97.0%
Australians
99.8
/100
|
#54
Exceptional
97.0%
Russians
99.8
/100
|
#55
Exceptional
97.0%
Serbians
99.8
/100
|
#56
Exceptional
97.0%
Americans
99.8
/100
|
#57
Exceptional
97.0%
Whites/Caucasians
99.8
/100
|
#58
Exceptional
97.0%
Macedonians
99.8
/100
|
#59
Exceptional
97.0%
Immigrants | Canada
99.8
/100
|
#60
Exceptional
96.9%