Czechoslovakian vs Yugoslavian Doctorate Degree
COMPARE
Czechoslovakian
Yugoslavian
Doctorate Degree
Doctorate Degree Comparison
Czechoslovakians
Yugoslavians
1.8%
DOCTORATE DEGREE
33.0/ 100
METRIC RATING
187th/ 347
METRIC RANK
1.7%
DOCTORATE DEGREE
17.1/ 100
METRIC RATING
207th/ 347
METRIC RANK
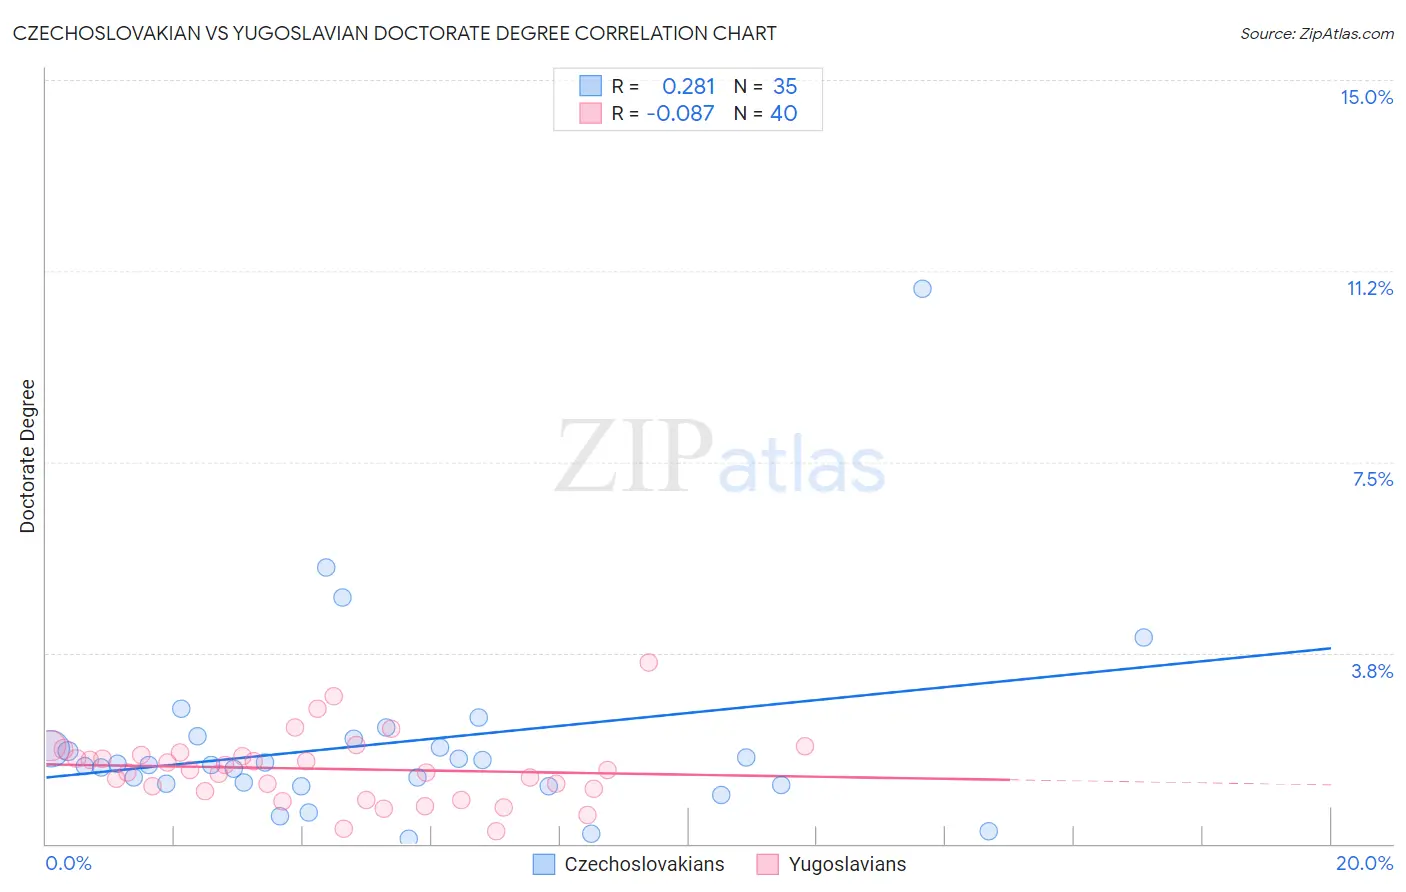
Czechoslovakian vs Yugoslavian Doctorate Degree Correlation Chart
The statistical analysis conducted on geographies consisting of 364,136,650 people shows a weak positive correlation between the proportion of Czechoslovakians and percentage of population with at least doctorate degree education in the United States with a correlation coefficient (R) of 0.281 and weighted average of 1.8%. Similarly, the statistical analysis conducted on geographies consisting of 283,502,598 people shows a slight negative correlation between the proportion of Yugoslavians and percentage of population with at least doctorate degree education in the United States with a correlation coefficient (R) of -0.087 and weighted average of 1.7%, a difference of 3.4%.
Doctorate Degree Correlation Summary
| Measurement | Czechoslovakian | Yugoslavian |
| Minimum | 0.10% | 0.24% |
| Maximum | 10.9% | 3.6% |
| Range | 10.8% | 3.3% |
| Mean | 2.0% | 1.5% |
| Median | 1.6% | 1.4% |
| Interquartile 25% (IQ1) | 1.1% | 1.0% |
| Interquartile 75% (IQ3) | 2.1% | 1.8% |
| Interquartile Range (IQR) | 0.92% | 0.73% |
| Standard Deviation (Sample) | 1.9% | 0.67% |
| Standard Deviation (Population) | 1.9% | 0.66% |
Demographics Similar to Czechoslovakians and Yugoslavians by Doctorate Degree
In terms of doctorate degree, the demographic groups most similar to Czechoslovakians are German (1.8%, a difference of 0.45%), French Canadian (1.8%, a difference of 0.49%), Immigrants from Costa Rica (1.8%, a difference of 0.50%), South American (1.8%, a difference of 0.62%), and Dutch (1.8%, a difference of 1.0%). Similarly, the demographic groups most similar to Yugoslavians are Immigrants from Peru (1.7%, a difference of 0.16%), Venezuelan (1.7%, a difference of 0.64%), Somali (1.7%, a difference of 1.1%), Immigrants from Vietnam (1.8%, a difference of 1.1%), and Portuguese (1.8%, a difference of 1.1%).
| Demographics | Rating | Rank | Doctorate Degree |
| Czechoslovakians | 33.0 /100 | #187 | Fair 1.8% |
| Germans | 30.5 /100 | #188 | Fair 1.8% |
| French Canadians | 30.2 /100 | #189 | Fair 1.8% |
| Immigrants | Costa Rica | 30.2 /100 | #190 | Fair 1.8% |
| South Americans | 29.5 /100 | #191 | Fair 1.8% |
| Dutch | 27.4 /100 | #192 | Fair 1.8% |
| German Russians | 27.1 /100 | #193 | Fair 1.8% |
| Uruguayans | 26.2 /100 | #194 | Fair 1.8% |
| Immigrants | Somalia | 25.4 /100 | #195 | Fair 1.8% |
| Sub-Saharan Africans | 25.1 /100 | #196 | Fair 1.8% |
| Chinese | 25.1 /100 | #197 | Fair 1.8% |
| Immigrants | Ghana | 24.6 /100 | #198 | Fair 1.8% |
| Immigrants | South America | 23.3 /100 | #199 | Fair 1.8% |
| Whites/Caucasians | 22.8 /100 | #200 | Fair 1.8% |
| Immigrants | Nigeria | 22.4 /100 | #201 | Fair 1.8% |
| Portuguese | 21.4 /100 | #202 | Fair 1.8% |
| Immigrants | Vietnam | 21.4 /100 | #203 | Fair 1.8% |
| Somalis | 21.2 /100 | #204 | Fair 1.7% |
| Venezuelans | 19.5 /100 | #205 | Poor 1.7% |
| Immigrants | Peru | 17.6 /100 | #206 | Poor 1.7% |
| Yugoslavians | 17.1 /100 | #207 | Poor 1.7% |