Comanche vs Yugoslavian Doctorate Degree
COMPARE
Comanche
Yugoslavian
Doctorate Degree
Doctorate Degree Comparison
Comanche
Yugoslavians
1.6%
DOCTORATE DEGREE
1.8/ 100
METRIC RATING
247th/ 347
METRIC RANK
1.7%
DOCTORATE DEGREE
17.1/ 100
METRIC RATING
207th/ 347
METRIC RANK
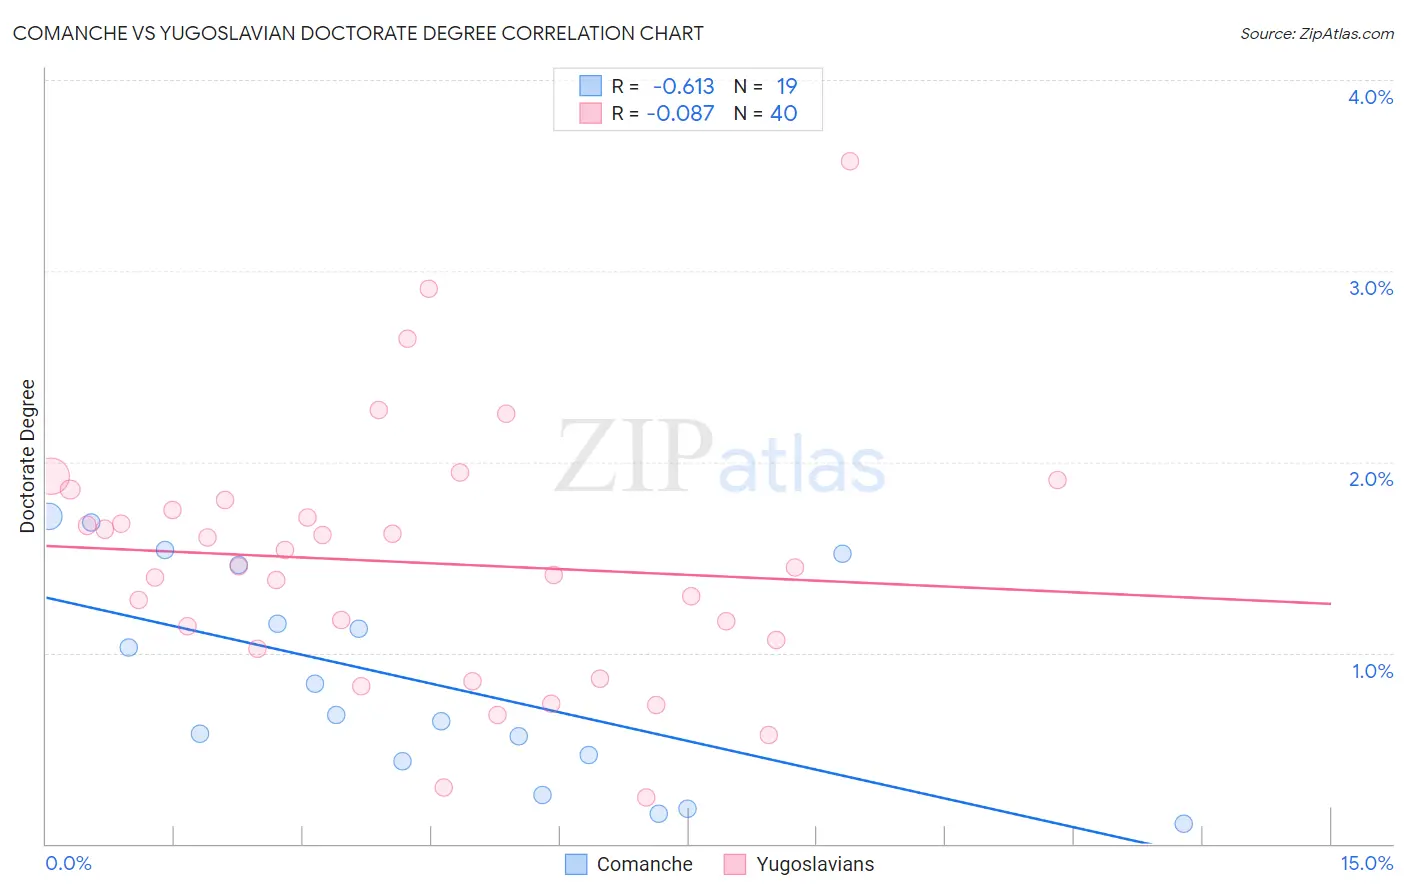
Comanche vs Yugoslavian Doctorate Degree Correlation Chart
The statistical analysis conducted on geographies consisting of 108,720,636 people shows a significant negative correlation between the proportion of Comanche and percentage of population with at least doctorate degree education in the United States with a correlation coefficient (R) of -0.613 and weighted average of 1.6%. Similarly, the statistical analysis conducted on geographies consisting of 283,502,598 people shows a slight negative correlation between the proportion of Yugoslavians and percentage of population with at least doctorate degree education in the United States with a correlation coefficient (R) of -0.087 and weighted average of 1.7%, a difference of 10.3%.
Doctorate Degree Correlation Summary
| Measurement | Comanche | Yugoslavian |
| Minimum | 0.10% | 0.24% |
| Maximum | 1.7% | 3.6% |
| Range | 1.6% | 3.3% |
| Mean | 0.85% | 1.5% |
| Median | 0.67% | 1.4% |
| Interquartile 25% (IQ1) | 0.43% | 1.0% |
| Interquartile 75% (IQ3) | 1.5% | 1.8% |
| Interquartile Range (IQR) | 1.0% | 0.73% |
| Standard Deviation (Sample) | 0.54% | 0.67% |
| Standard Deviation (Population) | 0.53% | 0.66% |
Similar Demographics by Doctorate Degree
Demographics Similar to Comanche by Doctorate Degree
In terms of doctorate degree, the demographic groups most similar to Comanche are Hmong (1.6%, a difference of 0.020%), Delaware (1.6%, a difference of 0.12%), African (1.6%, a difference of 0.12%), French American Indian (1.6%, a difference of 0.49%), and Potawatomi (1.6%, a difference of 0.59%).
| Demographics | Rating | Rank | Doctorate Degree |
| Immigrants | Panama | 2.4 /100 | #240 | Tragic 1.6% |
| Cheyenne | 2.3 /100 | #241 | Tragic 1.6% |
| Ottawa | 2.2 /100 | #242 | Tragic 1.6% |
| Native Hawaiians | 2.1 /100 | #243 | Tragic 1.6% |
| French American Indians | 2.0 /100 | #244 | Tragic 1.6% |
| Delaware | 1.9 /100 | #245 | Tragic 1.6% |
| Hmong | 1.8 /100 | #246 | Tragic 1.6% |
| Comanche | 1.8 /100 | #247 | Tragic 1.6% |
| Africans | 1.8 /100 | #248 | Tragic 1.6% |
| Potawatomi | 1.6 /100 | #249 | Tragic 1.6% |
| Immigrants | Fiji | 1.6 /100 | #250 | Tragic 1.6% |
| Apache | 1.3 /100 | #251 | Tragic 1.5% |
| Yuman | 1.1 /100 | #252 | Tragic 1.5% |
| Americans | 1.0 /100 | #253 | Tragic 1.5% |
| Immigrants | Cambodia | 1.0 /100 | #254 | Tragic 1.5% |
Demographics Similar to Yugoslavians by Doctorate Degree
In terms of doctorate degree, the demographic groups most similar to Yugoslavians are Immigrants from Peru (1.7%, a difference of 0.16%), Colombian (1.7%, a difference of 0.28%), Immigrants from Western Africa (1.7%, a difference of 0.47%), Tongan (1.7%, a difference of 0.56%), and Immigrants from Armenia (1.7%, a difference of 0.57%).
| Demographics | Rating | Rank | Doctorate Degree |
| Whites/Caucasians | 22.8 /100 | #200 | Fair 1.8% |
| Immigrants | Nigeria | 22.4 /100 | #201 | Fair 1.8% |
| Portuguese | 21.4 /100 | #202 | Fair 1.8% |
| Immigrants | Vietnam | 21.4 /100 | #203 | Fair 1.8% |
| Somalis | 21.2 /100 | #204 | Fair 1.7% |
| Venezuelans | 19.5 /100 | #205 | Poor 1.7% |
| Immigrants | Peru | 17.6 /100 | #206 | Poor 1.7% |
| Yugoslavians | 17.1 /100 | #207 | Poor 1.7% |
| Colombians | 16.1 /100 | #208 | Poor 1.7% |
| Immigrants | Western Africa | 15.4 /100 | #209 | Poor 1.7% |
| Tongans | 15.1 /100 | #210 | Poor 1.7% |
| Immigrants | Armenia | 15.1 /100 | #211 | Poor 1.7% |
| Immigrants | South Eastern Asia | 14.7 /100 | #212 | Poor 1.7% |
| Koreans | 14.2 /100 | #213 | Poor 1.7% |
| Pueblo | 14.2 /100 | #214 | Poor 1.7% |