Czechoslovakian vs Lebanese Doctorate Degree
COMPARE
Czechoslovakian
Lebanese
Doctorate Degree
Doctorate Degree Comparison
Czechoslovakians
Lebanese
1.8%
DOCTORATE DEGREE
33.0/ 100
METRIC RATING
187th/ 347
METRIC RANK
2.1%
DOCTORATE DEGREE
96.0/ 100
METRIC RATING
117th/ 347
METRIC RANK
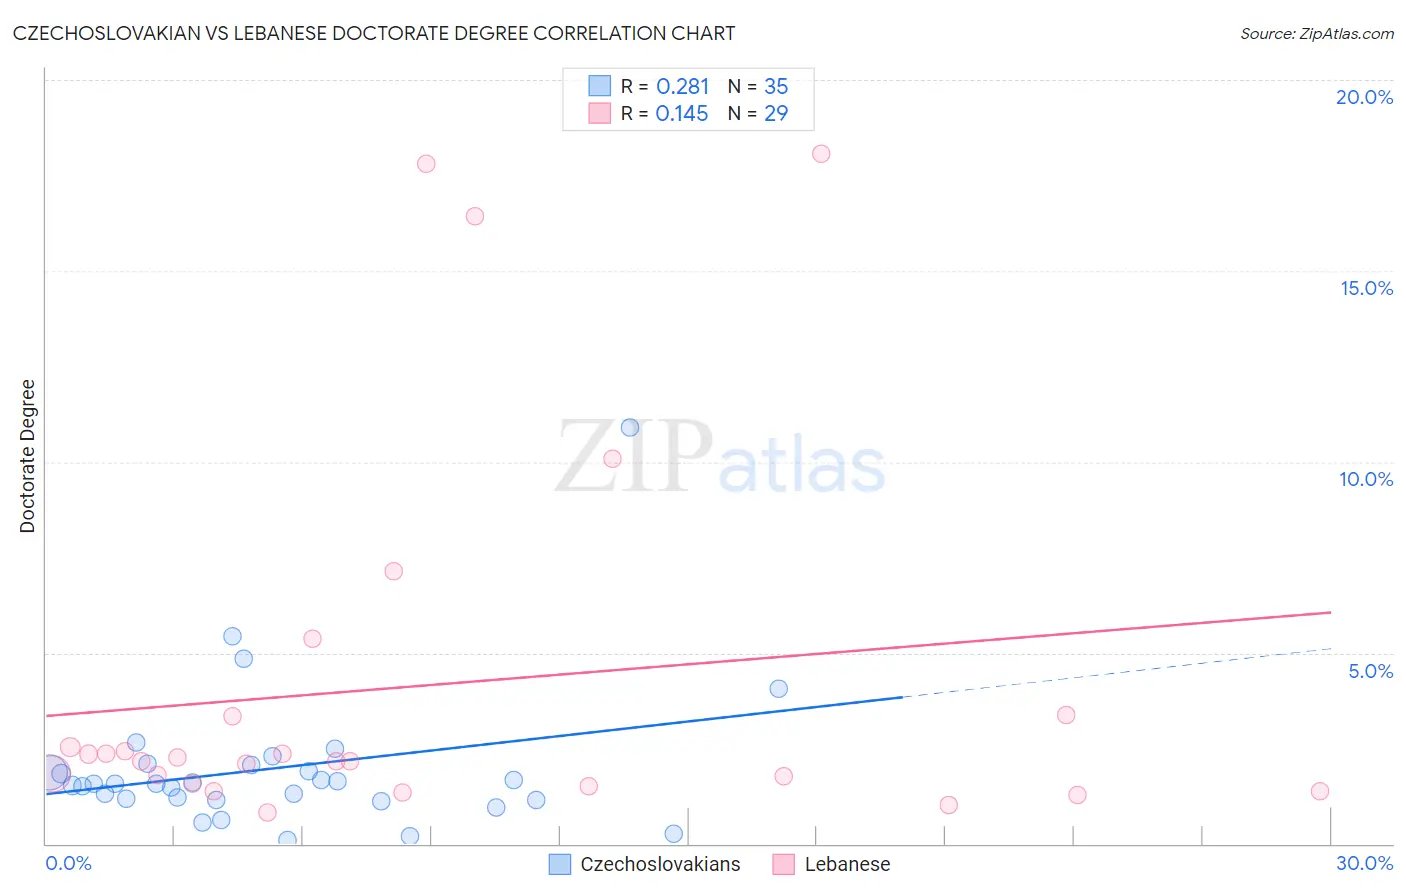
Czechoslovakian vs Lebanese Doctorate Degree Correlation Chart
The statistical analysis conducted on geographies consisting of 364,136,650 people shows a weak positive correlation between the proportion of Czechoslovakians and percentage of population with at least doctorate degree education in the United States with a correlation coefficient (R) of 0.281 and weighted average of 1.8%. Similarly, the statistical analysis conducted on geographies consisting of 398,305,554 people shows a poor positive correlation between the proportion of Lebanese and percentage of population with at least doctorate degree education in the United States with a correlation coefficient (R) of 0.145 and weighted average of 2.1%, a difference of 14.6%.
Doctorate Degree Correlation Summary
| Measurement | Czechoslovakian | Lebanese |
| Minimum | 0.10% | 0.83% |
| Maximum | 10.9% | 18.1% |
| Range | 10.8% | 17.3% |
| Mean | 2.0% | 4.1% |
| Median | 1.6% | 2.2% |
| Interquartile 25% (IQ1) | 1.1% | 1.5% |
| Interquartile 75% (IQ3) | 2.1% | 3.3% |
| Interquartile Range (IQR) | 0.92% | 1.8% |
| Standard Deviation (Sample) | 1.9% | 5.0% |
| Standard Deviation (Population) | 1.9% | 4.9% |
Similar Demographics by Doctorate Degree
Demographics Similar to Czechoslovakians by Doctorate Degree
In terms of doctorate degree, the demographic groups most similar to Czechoslovakians are Peruvian (1.8%, a difference of 0.23%), German (1.8%, a difference of 0.45%), French Canadian (1.8%, a difference of 0.49%), Immigrants from Costa Rica (1.8%, a difference of 0.50%), and Slovak (1.8%, a difference of 0.55%).
| Demographics | Rating | Rank | Doctorate Degree |
| Scandinavians | 48.0 /100 | #180 | Average 1.8% |
| Immigrants | Immigrants | 46.2 /100 | #181 | Average 1.8% |
| Immigrants | Afghanistan | 44.3 /100 | #182 | Average 1.8% |
| Finns | 42.1 /100 | #183 | Average 1.8% |
| Nigerians | 39.9 /100 | #184 | Fair 1.8% |
| Slovaks | 36.4 /100 | #185 | Fair 1.8% |
| Peruvians | 34.4 /100 | #186 | Fair 1.8% |
| Czechoslovakians | 33.0 /100 | #187 | Fair 1.8% |
| Germans | 30.5 /100 | #188 | Fair 1.8% |
| French Canadians | 30.2 /100 | #189 | Fair 1.8% |
| Immigrants | Costa Rica | 30.2 /100 | #190 | Fair 1.8% |
| South Americans | 29.5 /100 | #191 | Fair 1.8% |
| Dutch | 27.4 /100 | #192 | Fair 1.8% |
| German Russians | 27.1 /100 | #193 | Fair 1.8% |
| Uruguayans | 26.2 /100 | #194 | Fair 1.8% |
Demographics Similar to Lebanese by Doctorate Degree
In terms of doctorate degree, the demographic groups most similar to Lebanese are Icelander (2.1%, a difference of 0.040%), Maltese (2.1%, a difference of 0.17%), Pakistani (2.0%, a difference of 0.17%), Immigrants from Morocco (2.0%, a difference of 0.45%), and Taiwanese (2.1%, a difference of 0.64%).
| Demographics | Rating | Rank | Doctorate Degree |
| Brazilians | 97.2 /100 | #110 | Exceptional 2.1% |
| Immigrants | Pakistan | 97.1 /100 | #111 | Exceptional 2.1% |
| Syrians | 97.1 /100 | #112 | Exceptional 2.1% |
| Immigrants | Italy | 96.9 /100 | #113 | Exceptional 2.1% |
| Immigrants | Croatia | 96.8 /100 | #114 | Exceptional 2.1% |
| Taiwanese | 96.7 /100 | #115 | Exceptional 2.1% |
| Maltese | 96.2 /100 | #116 | Exceptional 2.1% |
| Lebanese | 96.0 /100 | #117 | Exceptional 2.1% |
| Icelanders | 96.0 /100 | #118 | Exceptional 2.1% |
| Pakistanis | 95.8 /100 | #119 | Exceptional 2.0% |
| Immigrants | Morocco | 95.5 /100 | #120 | Exceptional 2.0% |
| Immigrants | Jordan | 94.8 /100 | #121 | Exceptional 2.0% |
| Immigrants | Southern Europe | 94.7 /100 | #122 | Exceptional 2.0% |
| Croatians | 94.0 /100 | #123 | Exceptional 2.0% |
| Ute | 93.2 /100 | #124 | Exceptional 2.0% |