Czechoslovakian vs Immigrants from Western Europe 7th Grade
COMPARE
Czechoslovakian
Immigrants from Western Europe
7th Grade
7th Grade Comparison
Czechoslovakians
Immigrants from Western Europe
97.1%
7TH GRADE
99.9/ 100
METRIC RATING
45th/ 347
METRIC RANK
96.7%
7TH GRADE
98.9/ 100
METRIC RATING
92nd/ 347
METRIC RANK
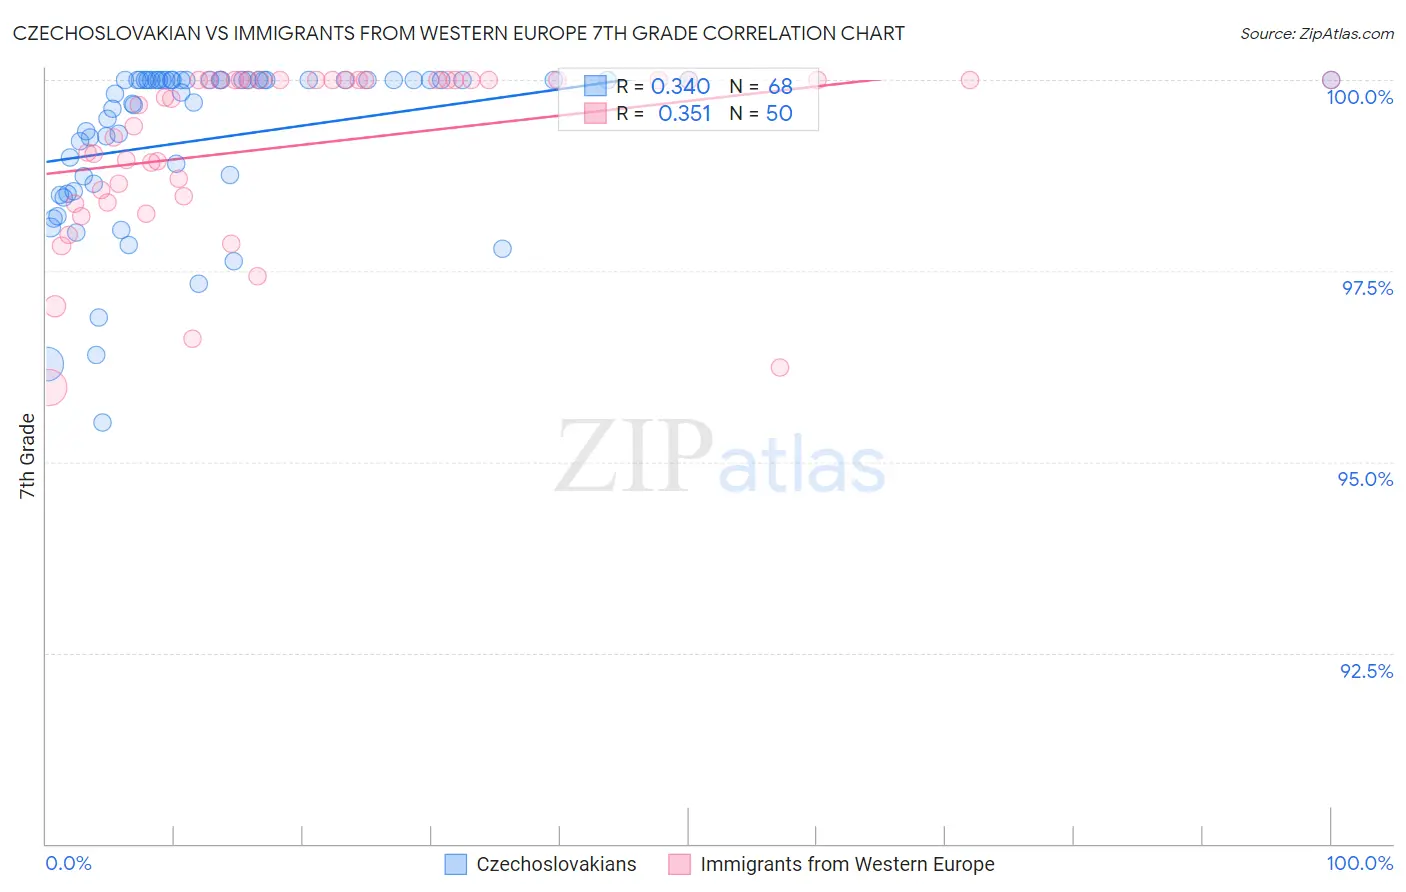
Czechoslovakian vs Immigrants from Western Europe 7th Grade Correlation Chart
The statistical analysis conducted on geographies consisting of 368,666,801 people shows a mild positive correlation between the proportion of Czechoslovakians and percentage of population with at least 7th grade education in the United States with a correlation coefficient (R) of 0.340 and weighted average of 97.1%. Similarly, the statistical analysis conducted on geographies consisting of 494,080,430 people shows a mild positive correlation between the proportion of Immigrants from Western Europe and percentage of population with at least 7th grade education in the United States with a correlation coefficient (R) of 0.351 and weighted average of 96.7%, a difference of 0.40%.
7th Grade Correlation Summary
| Measurement | Czechoslovakian | Immigrants from Western Europe |
| Minimum | 95.5% | 96.0% |
| Maximum | 100.0% | 100.0% |
| Range | 4.5% | 4.0% |
| Mean | 99.2% | 99.1% |
| Median | 99.9% | 99.8% |
| Interquartile 25% (IQ1) | 98.6% | 98.5% |
| Interquartile 75% (IQ3) | 100.0% | 100.0% |
| Interquartile Range (IQR) | 1.4% | 1.5% |
| Standard Deviation (Sample) | 1.1% | 1.1% |
| Standard Deviation (Population) | 1.1% | 1.1% |
Similar Demographics by 7th Grade
Demographics Similar to Czechoslovakians by 7th Grade
In terms of 7th grade, the demographic groups most similar to Czechoslovakians are Aleut (97.1%, a difference of 0.0%), Maltese (97.1%, a difference of 0.010%), Northern European (97.1%, a difference of 0.010%), Bulgarian (97.1%, a difference of 0.030%), and Celtic (97.1%, a difference of 0.030%).
| Demographics | Rating | Rank | 7th Grade |
| Belgians | 100.0 /100 | #38 | Exceptional 97.2% |
| Latvians | 100.0 /100 | #39 | Exceptional 97.2% |
| Luxembourgers | 100.0 /100 | #40 | Exceptional 97.2% |
| Eastern Europeans | 100.0 /100 | #41 | Exceptional 97.2% |
| Chinese | 99.9 /100 | #42 | Exceptional 97.1% |
| Maltese | 99.9 /100 | #43 | Exceptional 97.1% |
| Northern Europeans | 99.9 /100 | #44 | Exceptional 97.1% |
| Czechoslovakians | 99.9 /100 | #45 | Exceptional 97.1% |
| Aleuts | 99.9 /100 | #46 | Exceptional 97.1% |
| Bulgarians | 99.9 /100 | #47 | Exceptional 97.1% |
| Celtics | 99.9 /100 | #48 | Exceptional 97.1% |
| Slavs | 99.9 /100 | #49 | Exceptional 97.1% |
| Immigrants | Scotland | 99.9 /100 | #50 | Exceptional 97.1% |
| Estonians | 99.9 /100 | #51 | Exceptional 97.0% |
| Greeks | 99.9 /100 | #52 | Exceptional 97.0% |
Demographics Similar to Immigrants from Western Europe by 7th Grade
In terms of 7th grade, the demographic groups most similar to Immigrants from Western Europe are Immigrants from South Africa (96.7%, a difference of 0.0%), Osage (96.7%, a difference of 0.0%), Potawatomi (96.7%, a difference of 0.0%), Immigrants from Belgium (96.7%, a difference of 0.010%), and Puget Sound Salish (96.7%, a difference of 0.010%).
| Demographics | Rating | Rank | 7th Grade |
| Kiowa | 99.1 /100 | #85 | Exceptional 96.7% |
| Turks | 99.1 /100 | #86 | Exceptional 96.7% |
| Immigrants | Belgium | 99.0 /100 | #87 | Exceptional 96.7% |
| Puget Sound Salish | 99.0 /100 | #88 | Exceptional 96.7% |
| Cree | 99.0 /100 | #89 | Exceptional 96.7% |
| Immigrants | South Africa | 98.9 /100 | #90 | Exceptional 96.7% |
| Osage | 98.9 /100 | #91 | Exceptional 96.7% |
| Immigrants | Western Europe | 98.9 /100 | #92 | Exceptional 96.7% |
| Potawatomi | 98.9 /100 | #93 | Exceptional 96.7% |
| Lebanese | 98.8 /100 | #94 | Exceptional 96.7% |
| Immigrants | Australia | 98.8 /100 | #95 | Exceptional 96.7% |
| Immigrants | Denmark | 98.7 /100 | #96 | Exceptional 96.7% |
| Immigrants | Germany | 98.7 /100 | #97 | Exceptional 96.7% |
| Immigrants | Sweden | 98.7 /100 | #98 | Exceptional 96.7% |
| Menominee | 98.7 /100 | #99 | Exceptional 96.7% |