Malaysian vs Immigrants from Denmark 5th Grade
COMPARE
Malaysian
Immigrants from Denmark
5th Grade
5th Grade Comparison
Malaysians
Immigrants from Denmark
96.5%
5TH GRADE
0.0/ 100
METRIC RATING
291st/ 347
METRIC RANK
97.8%
5TH GRADE
98.6/ 100
METRIC RATING
94th/ 347
METRIC RANK
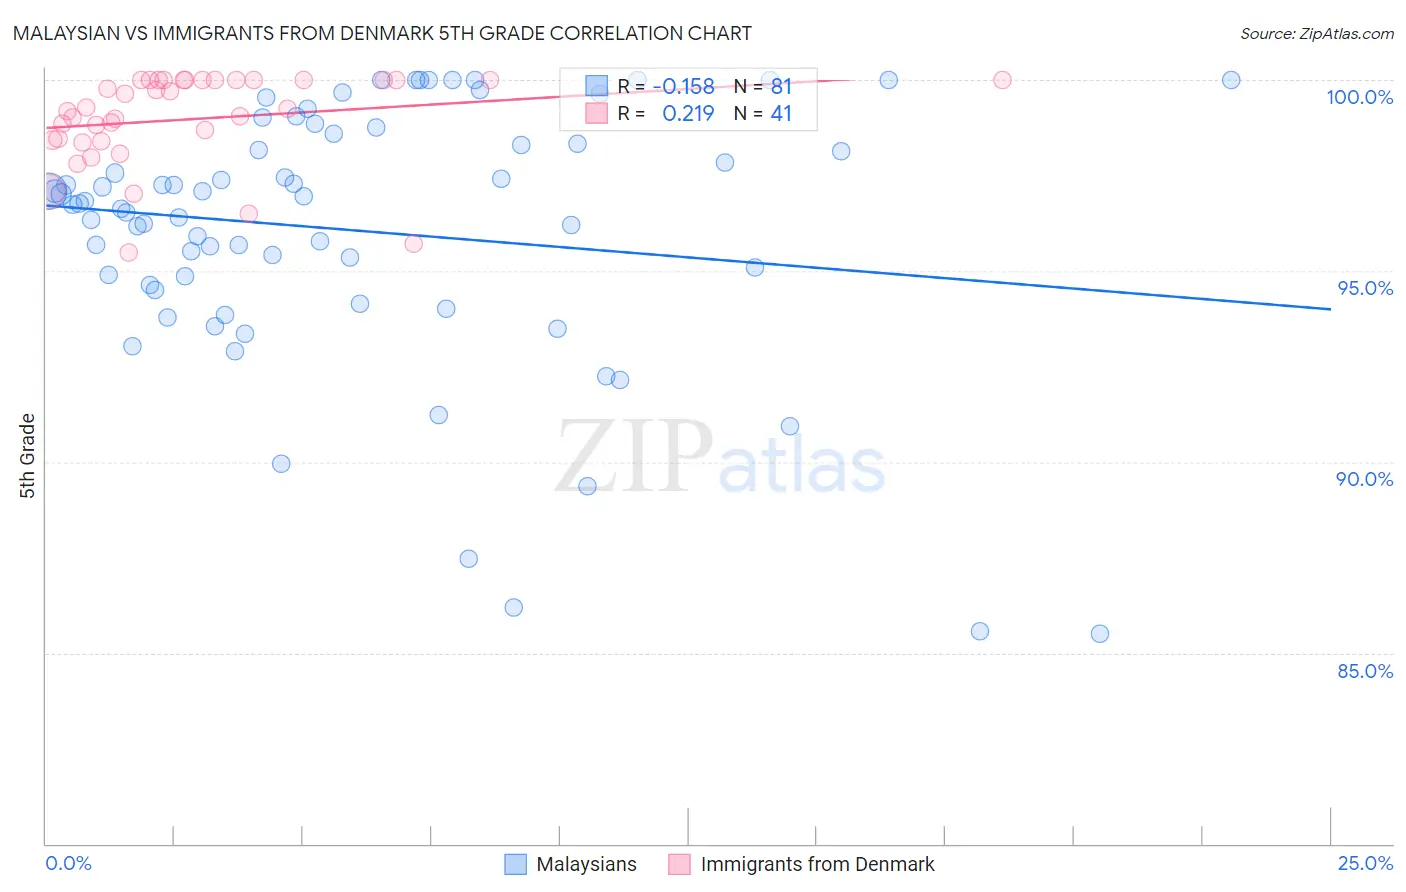
Malaysian vs Immigrants from Denmark 5th Grade Correlation Chart
The statistical analysis conducted on geographies consisting of 226,107,000 people shows a poor negative correlation between the proportion of Malaysians and percentage of population with at least 5th grade education in the United States with a correlation coefficient (R) of -0.158 and weighted average of 96.5%. Similarly, the statistical analysis conducted on geographies consisting of 136,430,932 people shows a weak positive correlation between the proportion of Immigrants from Denmark and percentage of population with at least 5th grade education in the United States with a correlation coefficient (R) of 0.219 and weighted average of 97.8%, a difference of 1.3%.
5th Grade Correlation Summary
| Measurement | Malaysian | Immigrants from Denmark |
| Minimum | 85.5% | 95.5% |
| Maximum | 100.0% | 100.0% |
| Range | 14.5% | 4.5% |
| Mean | 96.1% | 99.0% |
| Median | 96.8% | 99.3% |
| Interquartile 25% (IQ1) | 94.6% | 98.4% |
| Interquartile 75% (IQ3) | 98.5% | 100.0% |
| Interquartile Range (IQR) | 3.9% | 1.6% |
| Standard Deviation (Sample) | 3.4% | 1.2% |
| Standard Deviation (Population) | 3.4% | 1.2% |
Similar Demographics by 5th Grade
Demographics Similar to Malaysians by 5th Grade
In terms of 5th grade, the demographic groups most similar to Malaysians are British West Indian (96.5%, a difference of 0.0%), Somali (96.5%, a difference of 0.0%), Immigrants from West Indies (96.5%, a difference of 0.020%), Immigrants from Grenada (96.5%, a difference of 0.020%), and Immigrants from Eritrea (96.4%, a difference of 0.060%).
| Demographics | Rating | Rank | 5th Grade |
| Immigrants | Trinidad and Tobago | 0.1 /100 | #284 | Tragic 96.6% |
| Immigrants | St. Vincent and the Grenadines | 0.1 /100 | #285 | Tragic 96.6% |
| Immigrants | Thailand | 0.1 /100 | #286 | Tragic 96.6% |
| Immigrants | Afghanistan | 0.1 /100 | #287 | Tragic 96.6% |
| Immigrants | Barbados | 0.0 /100 | #288 | Tragic 96.6% |
| Immigrants | West Indies | 0.0 /100 | #289 | Tragic 96.5% |
| British West Indians | 0.0 /100 | #290 | Tragic 96.5% |
| Malaysians | 0.0 /100 | #291 | Tragic 96.5% |
| Somalis | 0.0 /100 | #292 | Tragic 96.5% |
| Immigrants | Grenada | 0.0 /100 | #293 | Tragic 96.5% |
| Immigrants | Eritrea | 0.0 /100 | #294 | Tragic 96.4% |
| Immigrants | Somalia | 0.0 /100 | #295 | Tragic 96.4% |
| Immigrants | South Eastern Asia | 0.0 /100 | #296 | Tragic 96.3% |
| Haitians | 0.0 /100 | #297 | Tragic 96.3% |
| Immigrants | Dominica | 0.0 /100 | #298 | Tragic 96.2% |
Demographics Similar to Immigrants from Denmark by 5th Grade
In terms of 5th grade, the demographic groups most similar to Immigrants from Denmark are Delaware (97.8%, a difference of 0.0%), Romanian (97.8%, a difference of 0.0%), Immigrants from Germany (97.8%, a difference of 0.0%), Immigrants from Western Europe (97.8%, a difference of 0.010%), and Immigrants from Sweden (97.8%, a difference of 0.010%).
| Demographics | Rating | Rank | 5th Grade |
| Immigrants | Australia | 98.8 /100 | #87 | Exceptional 97.8% |
| Shoshone | 98.8 /100 | #88 | Exceptional 97.8% |
| Immigrants | South Africa | 98.8 /100 | #89 | Exceptional 97.8% |
| Immigrants | Ireland | 98.8 /100 | #90 | Exceptional 97.8% |
| Immigrants | Western Europe | 98.8 /100 | #91 | Exceptional 97.8% |
| Immigrants | Sweden | 98.7 /100 | #92 | Exceptional 97.8% |
| Delaware | 98.6 /100 | #93 | Exceptional 97.8% |
| Immigrants | Denmark | 98.6 /100 | #94 | Exceptional 97.8% |
| Romanians | 98.6 /100 | #95 | Exceptional 97.8% |
| Immigrants | Germany | 98.5 /100 | #96 | Exceptional 97.8% |
| Cree | 98.4 /100 | #97 | Exceptional 97.7% |
| Yugoslavians | 98.3 /100 | #98 | Exceptional 97.7% |
| Turks | 98.3 /100 | #99 | Exceptional 97.7% |
| Puget Sound Salish | 98.3 /100 | #100 | Exceptional 97.7% |
| South Africans | 98.3 /100 | #101 | Exceptional 97.7% |