Immigrants from Congo vs Brazilian Professional Degree
COMPARE
Immigrants from Congo
Brazilian
Professional Degree
Professional Degree Comparison
Immigrants from Congo
Brazilians
3.6%
PROFESSIONAL DEGREE
0.8/ 100
METRIC RATING
265th/ 347
METRIC RANK
5.0%
PROFESSIONAL DEGREE
97.4/ 100
METRIC RATING
111th/ 347
METRIC RANK
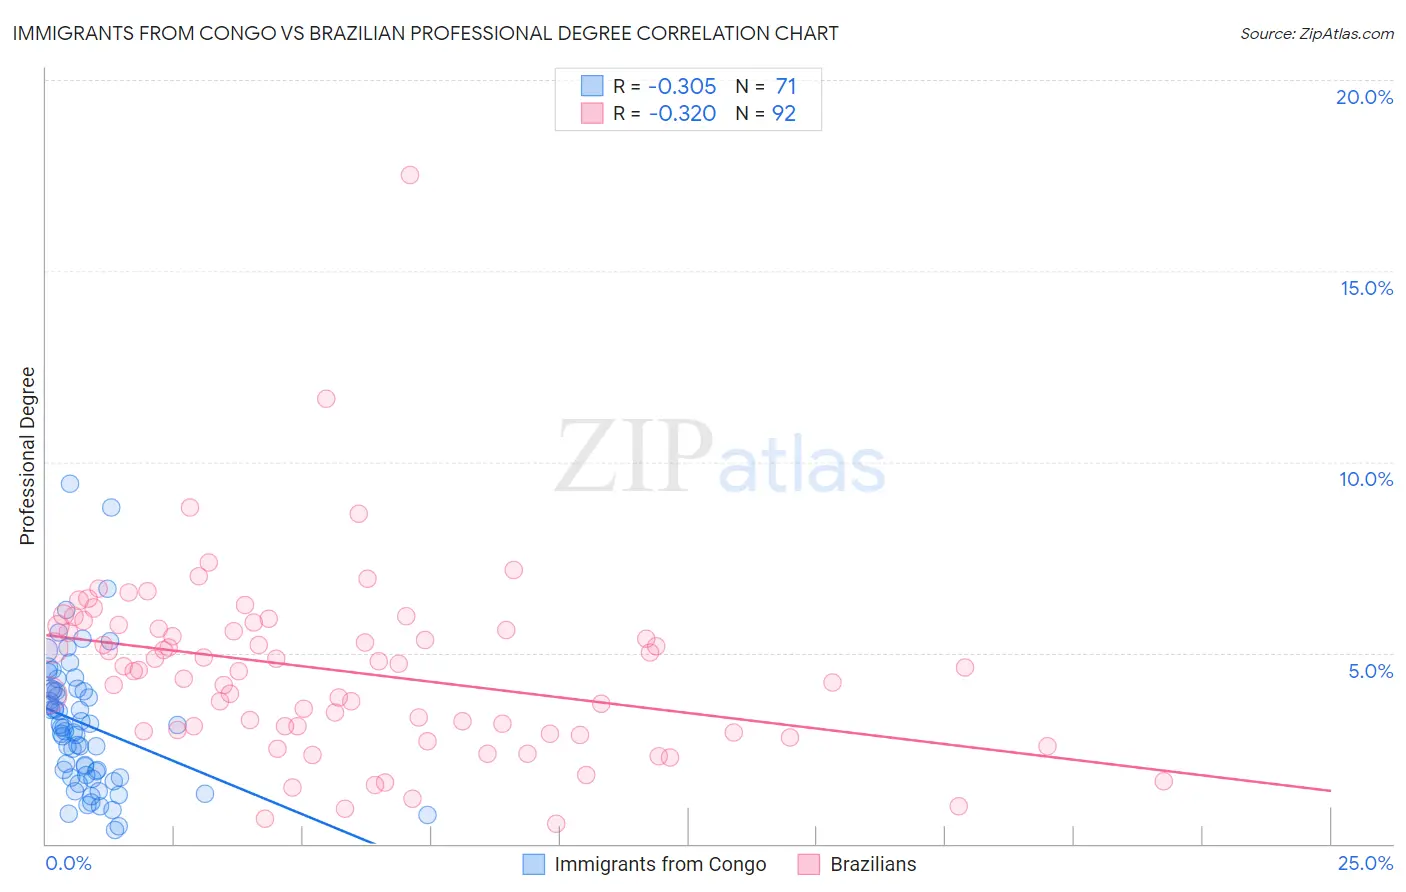
Immigrants from Congo vs Brazilian Professional Degree Correlation Chart
The statistical analysis conducted on geographies consisting of 92,025,437 people shows a mild negative correlation between the proportion of Immigrants from Congo and percentage of population with at least professional degree education in the United States with a correlation coefficient (R) of -0.305 and weighted average of 3.6%. Similarly, the statistical analysis conducted on geographies consisting of 323,483,336 people shows a mild negative correlation between the proportion of Brazilians and percentage of population with at least professional degree education in the United States with a correlation coefficient (R) of -0.320 and weighted average of 5.0%, a difference of 36.9%.
Professional Degree Correlation Summary
| Measurement | Immigrants from Congo | Brazilian |
| Minimum | 0.35% | 0.54% |
| Maximum | 9.4% | 17.5% |
| Range | 9.1% | 17.0% |
| Mean | 3.1% | 4.5% |
| Median | 3.0% | 4.6% |
| Interquartile 25% (IQ1) | 1.7% | 3.0% |
| Interquartile 75% (IQ3) | 4.0% | 5.7% |
| Interquartile Range (IQR) | 2.3% | 2.7% |
| Standard Deviation (Sample) | 1.8% | 2.4% |
| Standard Deviation (Population) | 1.8% | 2.4% |
Similar Demographics by Professional Degree
Demographics Similar to Immigrants from Congo by Professional Degree
In terms of professional degree, the demographic groups most similar to Immigrants from Congo are Immigrants from Cambodia (3.6%, a difference of 0.040%), Hopi (3.6%, a difference of 0.060%), Central American Indian (3.6%, a difference of 0.32%), U.S. Virgin Islander (3.7%, a difference of 0.56%), and Immigrants from Guyana (3.7%, a difference of 0.57%).
| Demographics | Rating | Rank | Professional Degree |
| Immigrants | St. Vincent and the Grenadines | 1.1 /100 | #258 | Tragic 3.7% |
| Africans | 1.0 /100 | #259 | Tragic 3.7% |
| Indonesians | 1.0 /100 | #260 | Tragic 3.7% |
| Immigrants | Guyana | 1.0 /100 | #261 | Tragic 3.7% |
| U.S. Virgin Islanders | 1.0 /100 | #262 | Tragic 3.7% |
| Hopi | 0.9 /100 | #263 | Tragic 3.6% |
| Immigrants | Cambodia | 0.9 /100 | #264 | Tragic 3.6% |
| Immigrants | Congo | 0.8 /100 | #265 | Tragic 3.6% |
| Central American Indians | 0.8 /100 | #266 | Tragic 3.6% |
| Delaware | 0.7 /100 | #267 | Tragic 3.6% |
| Aleuts | 0.7 /100 | #268 | Tragic 3.6% |
| Immigrants | Cuba | 0.6 /100 | #269 | Tragic 3.6% |
| Central Americans | 0.6 /100 | #270 | Tragic 3.6% |
| Belizeans | 0.5 /100 | #271 | Tragic 3.6% |
| Immigrants | Jamaica | 0.5 /100 | #272 | Tragic 3.6% |
Demographics Similar to Brazilians by Professional Degree
In terms of professional degree, the demographic groups most similar to Brazilians are Taiwanese (5.0%, a difference of 0.22%), Immigrants from Pakistan (5.0%, a difference of 0.24%), Immigrants from Morocco (5.0%, a difference of 0.69%), Lebanese (5.0%, a difference of 0.74%), and Moroccan (5.0%, a difference of 0.79%).
| Demographics | Rating | Rank | Professional Degree |
| Arabs | 98.2 /100 | #104 | Exceptional 5.0% |
| Immigrants | Uganda | 98.2 /100 | #105 | Exceptional 5.0% |
| Immigrants | Ukraine | 98.2 /100 | #106 | Exceptional 5.0% |
| Maltese | 98.1 /100 | #107 | Exceptional 5.0% |
| Immigrants | Southern Europe | 98.1 /100 | #108 | Exceptional 5.0% |
| British | 98.0 /100 | #109 | Exceptional 5.0% |
| Lebanese | 98.0 /100 | #110 | Exceptional 5.0% |
| Brazilians | 97.4 /100 | #111 | Exceptional 5.0% |
| Taiwanese | 97.3 /100 | #112 | Exceptional 5.0% |
| Immigrants | Pakistan | 97.2 /100 | #113 | Exceptional 5.0% |
| Immigrants | Morocco | 96.8 /100 | #114 | Exceptional 5.0% |
| Moroccans | 96.8 /100 | #115 | Exceptional 5.0% |
| Venezuelans | 96.3 /100 | #116 | Exceptional 4.9% |
| Immigrants | Syria | 96.0 /100 | #117 | Exceptional 4.9% |
| Croatians | 96.0 /100 | #118 | Exceptional 4.9% |